Indiana's Exports to the World
Across the United States, central states tend to have a much smaller share of U.S. exports than Midwest and coastal states. Indiana's share was on par with Wisconsin and Kentucky, ranging from 1 percent to 2.9 percent. Indiana exports have increased from about $11 billion in 1996 to $21.5 billion in 2005.
Indiana's exports grew $2.4 billion between 2004 and 2005 for a gain of 12.4 percent. Figure 1 shows Indiana exports grew faster than the nation in 2005, as was true for most of the previous years. However, since 2002 the state has seen its lead over the nation cut in half each subsequent year.
Figure 1: Percent Change in Indiana and U.S. Exports
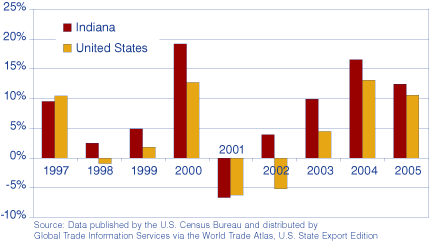
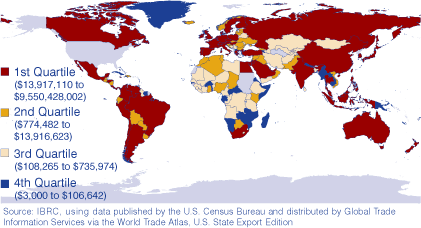
Figure 2 shows the path of Indiana exports once they leave the state, which ultimately encompasses the globe; however, the difference in export magnitude among the countries is significant. Whereas Cape Verde purchased $3,000 worth of Indiana exports in 2005, Canada purchased $9.6 billion.
Figure 2: Indiana's Export Destinations
Top Export Destinations
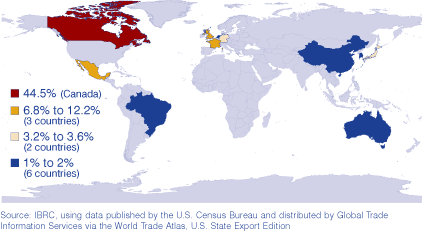
The top 10 destinations comprised 84.3 percent of Indiana's export sales. Figure 3 clearly shows that, although Indiana shipped exports to 198 countries in 2005, a select few received the bulk of the state's exports.
Figure 3: Indiana's Export Destinations Where Share of Exports Equals at Least 1 Percent
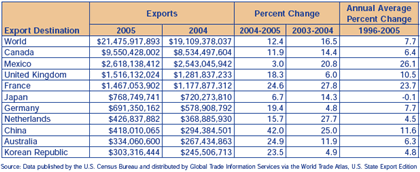
Canada was still Indiana's largest export destination with purchases of $9.6 billion in 2005, which was $1 billion more than 2004 (see Table 1). That represented an 11.9 percent increase from the previous year. Indiana exports to Canada in 2005 were 3.6 times the value of the second largest export destination (Mexico) and almost 32 times that of the 10th largest export destination (the Korean Republic).
Table 1: Indiana's Top 10 Export Destinations: Value of and Change in Exports
Indiana's exports to China exploded with an over-the-year increase of 42 percent; that is 17 percentage points greater than the previous year's growth rate. Where China outstripped the other top export destinations in growth, the Korean Republic saw the biggest improvement over last year in its rate of growth. Indiana's export growth rates to the Korean Republic increased almost five-fold from 4.9 percent to 23.5 percent from 2004 to 2005, an 18.6 percentage point increase.
Australia and France also had growth rates over 20 percent. Although the entire top 10 destinations had increases in Indiana exports, several of the top 10 destinations saw their growth rates slow in 2005. Mexico, Netherlands, Japan, France and Canada had slower growth in the number of exports shipped from Indiana.
The United Kingdom's growth rate in 2005 has tripled, going from 6.0 percent to 18.3 percent. Exports to Germany picked up steam in 2005, with a 14.6 percentage point increase in the rate of growth over the previous year.
The total share of the top 10 country destinations gained 0.3 percentage points from 2004 to reach 84.3 percent for 2005; this means the state has become a little more concentrated in its export sales. The increase was largely due to an increase in France's share of 0.7 percentage points and an increase in China's share of 0.4 percentage points. Canada made up 44.5 percent of Indiana exports in 2005, compared with 44.7 percent in 2004. Canada's share of Indiana exports has declined by 5.1 percentage points since 1996. Canada's share today is 9.8 percentage points lower than the high reached in 1999 and 1.3 percentage points higher than the low reached in 2001.
Spain, which had a 1.4 percent share in 2004, dropped out of the top 10 list in 2005. Now Spain is the 16th largest export destination for the state. Meanwhile Australia continues its dance between the ninth and 10th rank for Indiana's export destinations, and for 2005 it was the former. The Korean Republic continues to bounce in and out of the top 10, assuming the 10th slot in 2005.
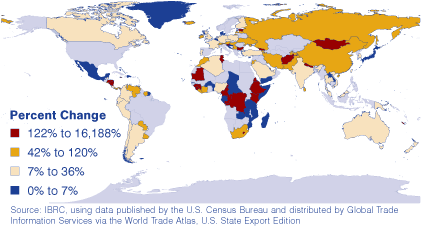
Figure 4 shows all the countries where Indiana exports increased. Note that countries experiencing the largest percent increases had little export volume to begin with, so increasing by large magnitudes is very probable.
Figure 4: Countries with Growth in Indiana's Exports, 2004 to 2005
Changes in Indiana Exports
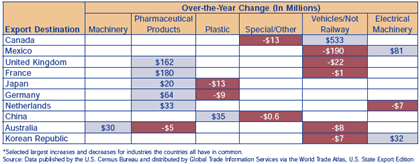
Table 2 identifies the largest changes between 2004 and 2005 in export sales by industry, both positive and negative, for the top 10 export destinations.
Table 2: Largest Positive and Negative Export Sales Changes by Industry, 2005*
There are two entries for each country—one for the largest export sales increase and one for the largest decrease. The export amount is shown in an attempt to visually depict which industries are having the biggest net effect. In this way, we clearly see the countries and industries that accounted most for change in 2005.
The biggest increases in Indiana exports to the top 10 export destinations (indicated by the largest numbers in the table) came from vehicles to Canada ($533 million) and pharmaceutical products to France ($180 million), United Kingdom ($162 million), Germany ($64 million) and the Netherlands ($33 million).
The largest declines in Indiana exports sales to the top 10 country destinations (indicated by the smallest numbers in the table) came from vehicles to Mexico (-$190 million) and the United Kingdom (-$22 million) and plastic to Japan (-$13 million).
The size and number of entries in each column show the impact of each industry to the total change in Indiana exports in 2005. Vehicles and pharmaceutical products each have six entries, indicating the sectors' importance for changes in Indiana exports to the top 10 countries. There has been a reversal since 2004, when vehicle exports to the world contributed 34 percent of the change versus pharmaceutical products' 9 percent. In 2005, pharmaceutical exports contributed 19 percent, while vehicles only contributed 15 percent to the change in the amount of exports from Indiana to the world. Despite the gains made in pharmaceutical exports in 2005, they only constitute 7 percent of Indiana exports to the world while vehicles are 27 percent. However, if pharmaceutical exports growth rates continue to outperform vehicles, then this sector will continue to get a bigger piece of the pie and move up in the rankings of Indiana's top commodities, as it has done since 1996.
Access the full report at http://www.ibrc.indiana.edu/international/pdf/exports_year-end_2005.pdf.
Amber Kostelac, Data Manager
Indiana Business Research Center,
Kelley School of Business, Indiana University

