Questionable Data Can Lead to Questionable Analysis
Economic analysts and economic policy makers are constantly confounded by questionable data. One of the most blatant examples arises from the differences in monthly employment data for the nation and the monthly data for the sum of the 50 states plus the District of Columbia. Employment data for each state are derived from monthly surveys of employers.
The national data now available include changes in benchmarking reflecting March 2001 data. As a result of these changes, the Bureau of Labor Statistics (BLS) adjusts the data for the prior years and the survey used to sample the current year. State data, however, are not consistent with the national figures.
As BLS explains the situation:
- "State estimation procedures are designed to produce accurate data for each individual state. BLS independently develops a national employment series; state estimates are not forced to sum to national totals nor vice versa. Because each state series is subject to larger sampling and non-sampling errors than the national series, summing them cumulates individual state level errors and can cause significant distortions at an aggregate level. Due to these statistical limitations, BLS does not compile a "sum-of-states" employment series, and cautions users that such a series is subject to a relatively large and volatile error structure."
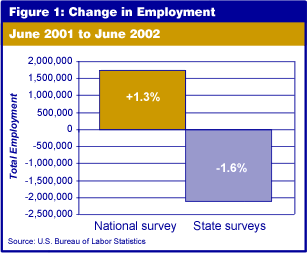
How different is the picture of the nation's economy when the two series are compared? Figure 1 shows that according to the national series from June 2001 to June 2002, total employment has climbed by 1.7 million (+1.3%) while the sum of the states shows a decline of 2.1 million (-1.6%).

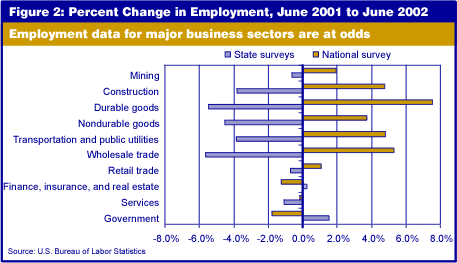
What is true at the level of total employment is also true for individual industries. Figure 2 shows how each major business sector differs when the nation survey is used compared to the sum of states approach. Not only are the data at odds for virtually every sector, but the extremes are most noteworthy. Durable goods manufacturing rose by 7.5 percent in the national survey while the sum of the states indicated a 5.5 percent decline. Only in services are the two approaches in agreement with respect to direction of change (both show declines).

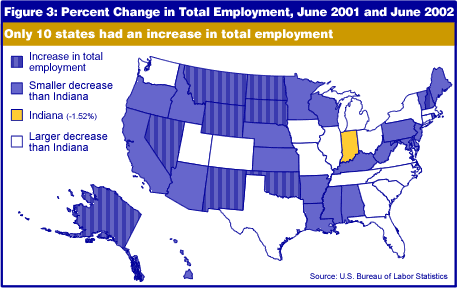
How is one to interpret the changes in individual states under these circumstances? For example, during the same June-to-June period, Indiana had a reported decline of 44,800 jobs (-1.5%), besting the sum of the states (-1.6%). But Indiana ranked 32nd in percent change among the 50 states. Is this serious if each state has its own error rates in these monthly estimates?
According to BLS, the states should not be added together and compared to the national figure. If the states are not to be added together, can they be compared to one another? Is it appropriate to rank Indiana among the states? Can we say that Indiana is doing better (or worse) than another state without knowing in some detail the comparability of the state surveys?
Among the 50 states, only 10 had an increase in total employment between June 2001 and June 2002 (see Figure 3). The map shown in Figure 3 suggests how the employment scene is changing, but the agency responsible for the data seems to caution us not to use these data. If that is the case, how are policy makers to make decisions about the course of the economy? Are political candidates likely to read the fine print on the BLS Web site? Are newspapers likely to avoid using the data for their editorials? How can economic analysts be expected to make sense of incomparable data?

Morton J. Marcus
Executive Director,
Indiana Business Research Center,
Kelley School of Business, Indiana University
