The Impact of Migration on Population Change
The population of any given area can only change through three processes: birth, death and migration. Health departments at the state and local levels keep fairly complete records of births and deaths, but information on gross migration flow—in or out—is practically non-existent. The net effect of migration on population size can be reasonably approximated, however, from census counts and vital statistics. Using data provided by the Indiana State Department of Health, along with 1990 and 2000 census counts, the Indiana Business Research Center estimates that net migration, the difference between inflows and outflows, accounted for 216,000 new state residents in the 1990s—40 percent of Indiana's total population increase for the decade
Figure 1 presents one view showing the magnitude of net migration by county in the 1990s. Indiana's two largest counties in population size, Marion and Lake, each lost more than 5,000 residents through migration. A large cluster of 15 counties in east central Indiana, along with nine other mostly rural counties scattered throughout western Indiana, also experienced net out-migration. Led by Hamilton County with a gain of 58,000 people, five counties gained over 10,000 new residents through migration. Hendricks, Johnson and Porter—counties on the suburban fringes of Indianapolis and Gary—also experienced migration gains over 10,000. In Elkhart County, a large stream of Hispanic migrants accounted for much of the population growth over the decade.
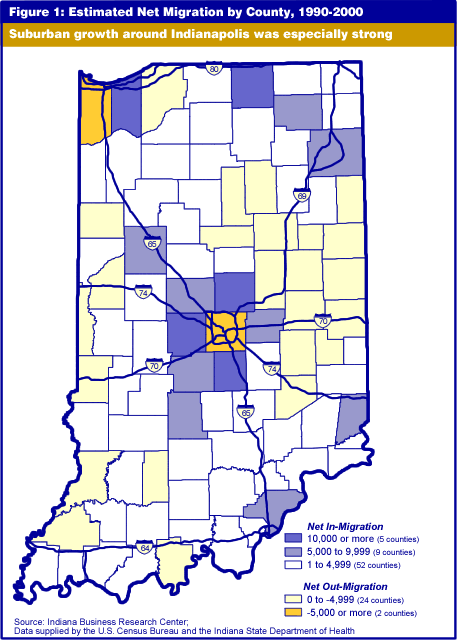
Suburban growth around Indianapolis was especially strong, such that six of seven counties bordering on Marion County gained at least 5,000 new residents via migration. The numbers indicate that migrants into the Indianapolis suburbs did not come exclusively from Marion County. The eight doughnut counties that make up the balance of the Indianapolis Metropolitan Statistical Area (MSA) collectively had a net gain of 122,000 migrants, while Marion County's net loss was fewer than 6,000.
The analysis of net migration can be extended to examine its distribution by age. A county's population age 30 to 34 in the year 2000, for example, is composed of county residents who were ages 20 to 24 in 1990, minus resident deaths among persons in this age cohort, plus net migration of persons in the age cohort to and from the county. Net migration, the unknown variable in this equation, is obtained through simple algebra.
Figure 2 shows the pattern of net migration by sex and selected age cohorts for the state between 1990 and 2000. Since this is a cumulative 10-year total referring to age categories 10 years apart, the interpretation of this information can be somewhat elusive. Indiana witnessed net out-migration among only one of the seven featured age cohorts. The cohort composed of people who were ages 15 to 19 in 1990 included students enrolled in high school in their hometowns as well as some students attending colleges and universities around the state. By 2000, this cohort shrunk by roughly 8,400 men and 7,300 women, as many young adults, by then aged 25 to 29, presumably completed their education and left the state for job opportunities elsewhere. Keep in mind that the negative bars displayed for this cohort do not mean that the state lost members of the 15 to 19 age group. In fact, Indiana's population of 15- to 19-year-olds increased by nearly 25,000 between 1990 and 2000.
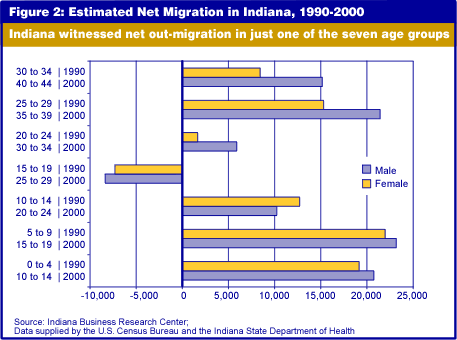
The news concerning other age cohorts is more encouraging. Growth in the 10 to 14 cohort in 1990 appears to be a testament to the ability of Indiana's colleges and universities to attract more out-of-state students than the number of high school Hoosiers it loses to other states after graduation. In the two oldest cohorts depicted in Figure 2, Indiana witnessed substantial net in-migration. The vast majority of people in these cohorts had completed their education by 1990, so migration for education is unlikely to be a factor. In-migrants outnumbered out-migrants in these cohorts, with perhaps many native sons and daughters of Indiana returning to the Hoosier state to raise a family.
Migration flows associated with college attendance are best examined by focusing on a county with a large university, such as Delaware County. Figure 3 clearly displays the impact of Ball State University in the positive net migration values for cohorts who were in the traditional college ages in 2000. This is also demonstrated in the negative values for older cohorts. Many members of the younger cohorts, too young for college in 1990, lived outside Delaware County at that time, but by 2000, large numbers of them had moved to the county to attend BSU. On the other hand, many people among the older cohorts were in the traditional college age range in 1990 and enrolled at BSU; by 2000 they were 25 to 34 years of age and had left the university and the county. (Note that the greater length of the female bars in the relevant college cohorts reflect that college enrollment is dominated by women.)
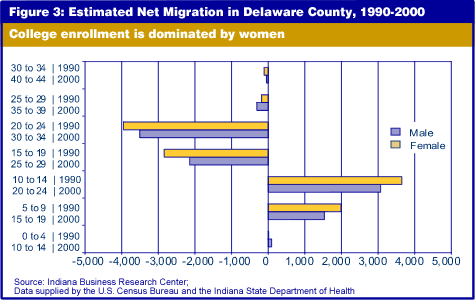
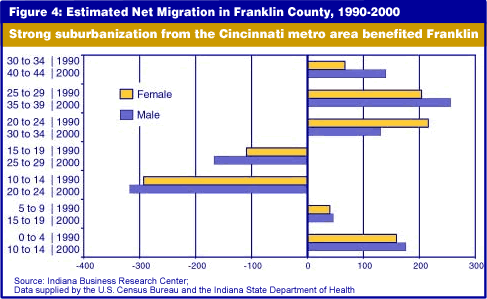
Figure 4 presents a typical pattern of net migration for a mostly rural Hoosier county. Net out-migration prevails among cohorts ages 10 to 14 and 15 to 19 in 1990. On balance, members of these cohorts moved out of Franklin County to attend college or seek jobs. In contrast, the cohort that was 20 to 24 in 1990 grew by more than 300 people by the year 2000, presumably on the strength of young adults returning to Franklin County after attending college or gaining work experience elsewhere. The county is adjacent to the Cincinnati-Hamilton, Ohio metropolitan area, and may have benefited from the strong suburbanization trend of the 1990s. This is suggested by the positive net migration streams for cohorts aged 35 to 44 in 2000.
Further evidence of city-to-suburb migration and its distribution by age is presented in Figure 5. The chart shows estimated 1990 to 2000 net migrants for seven age cohorts in the Indianapolis MSA, disaggregated into Marion County and the eight suburban doughnut counties. For the two youngest cohorts (ages 0 to 9 in 1990), Marion County was a net exporter and the suburbs were net importers of children. This reflects, of course, the migration behavior of the children's parents, represented primarily in the top two cohorts of Figure 5.
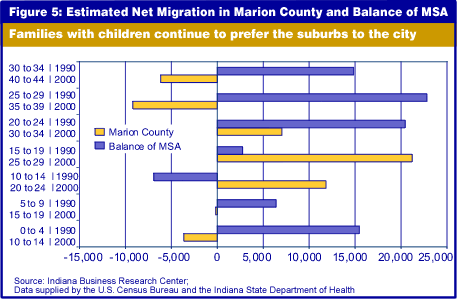
In the three middle cohorts, people ages 20 to 34 in 2000, Marion County experienced strong net in-migration, as more young adults moved into the urban center than moved out. This could be for a combination of reasons including jobs and lifestyle. The net flow of migrants is out of Marion County for older cohorts, however, perhaps due to family preferences in favor of suburban school districts.
John Besl
Research Demographer, Indiana Business Research Center,
Kelley School of Business, Indiana University
