Metro Areas Show Diverse Employment Patterns
Indiana's eleven metropolitan statistical areas demonstrate the dangers of making broad statements.
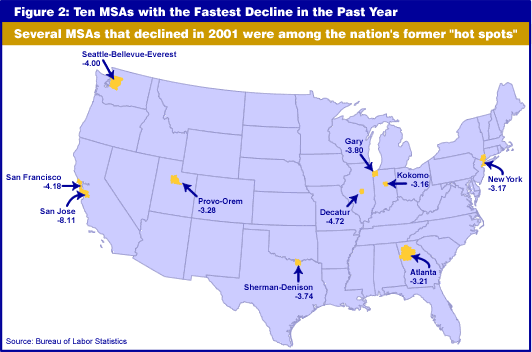
Over the past year (March 2001 to March 2002), the Lafayette MSA was the second fastest growing metro area in the nation in total employment. However, in the same period, employment growth in the Gary and Kokomo MSAs ranked in the bottom ten of 275 metro areas in the nation.
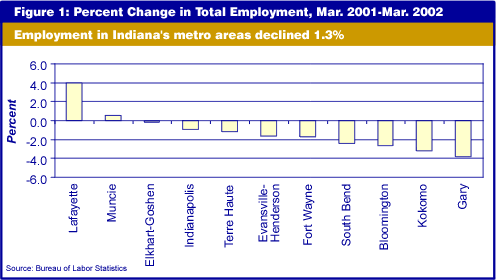
While the nation's metro areas experienced a 0.9 percent decline in total non-farm employment, Indiana's metro areas had a 1.3 percent decline. The range went from a 4.0 percent growth in the Lafayette metro area to a 3.8 percent drop in the Gary MSA (see Figure 1).

It is interesting to note that among the metro areas with the worst record over this one-year period are some of the nation's formerly most attractive "hot spots" including San Francisco and San Jose (CA), plus Atlanta (GA) (see Figure 2).

Nationally, manufacturing accounted for 72.7 percent of the decline in metropolitan
area employment, as 681,200 of the 937,200 jobs lost were in manufacturing.
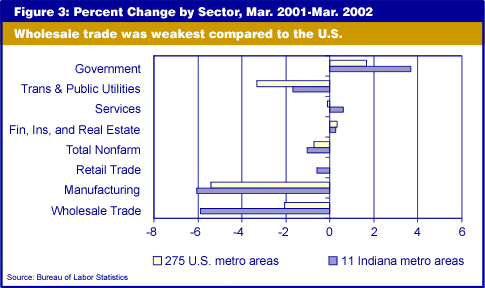
Indiana painted a similar picture. Here, manufacturing job losses accounted
for 80.8 percent of metro area job losses. Figure 3 details the gains and
losses for both Indiana and the nation by sector.
Indiana exceeded the nation's growth rate in three sectors (government, services,
and transportation and public utilities). Relative to the nation, Indiana's
performance was weakest in wholesale trade.

