Are Hoosiers Wealthy and Wise?
Last year, census results provided a picture of our age mix and lifestyles. Now, results from the long-form part of the census (the sample of one in six households) show us our relative wealth and poverty, levels of education we had achieved, the age and value of our housing stock and much more. This article scratches the surface of the data released May 14. Massive amounts of data will be released this summer in the form of Summary File 3, which provides data at the census tract and block group levels of geography. As always, access to the data in profile and other forms is available on STATS Indiana-go to www.stats.indiana.edu.
Wealth and Poverty
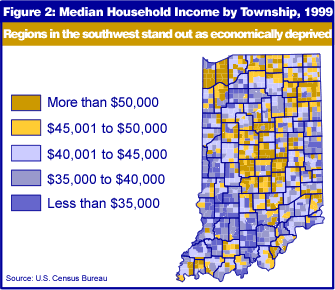
In five Hoosier counties, median household income exceeded $50,000. Four of the five highest-income counties-Hamilton, Hancock, Hendricks and Johnson-are located on the suburban fringe of Indianapolis. Porter County, part of the Gary and Chicago metropolitan areas, also had median household income of $50,000 or more in 1999 (see Figures 1 and 2).
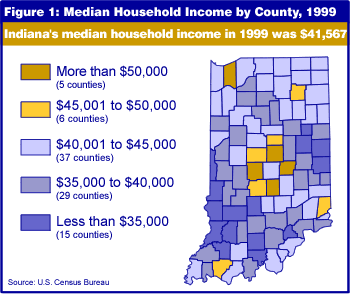
The next group of counties on the income tier includes six more suburban counties: Boone and Morgan, both in the Indianapolis MSA; Tipton (Kokomo MSA); Dearborn (Cincinnati PMSA); Warrick (Evansville MSA); and Whitley (Fort Wayne MSA). In each of these counties, the median household income in 1999 fell between $45,000 and $50,000.
Fifteen counties had median household income in 1999 below $35,000. These counties were found mainly in southern Indiana, on or near the Illinois border, and in another cluster in the east central region of the state.
Five contiguous counties in Indiana's southwest region stand out on multiple measures of economic deprivation. Knox, Daviess, Greene, Sullivan and Vigo counties all landed in the low end on median household income and were home to high percentages of households with income under $10,000 and families living below poverty level.
In each of these counties, median household income in 1999 was less than $35,000. Furthermore, 1999 income was under $10,000 in at least 10 percent of county households. Finally, the family poverty rate was 8 percent or higher in each county.
"In other words, at least one in 12 families in these counties subsisted below the federal poverty level," said John Besl, IBRC demographer. "Five other Indiana counties hit this same trifecta of deprivation. Those five are Crawford, Orange, Scott, Wayne and Delaware."
Gains in Educational Attainment
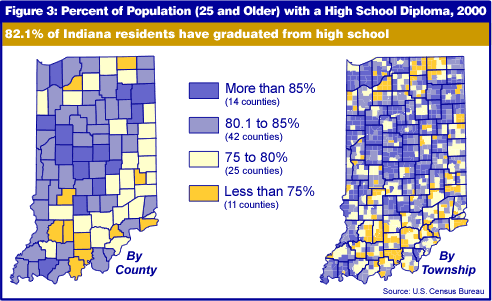
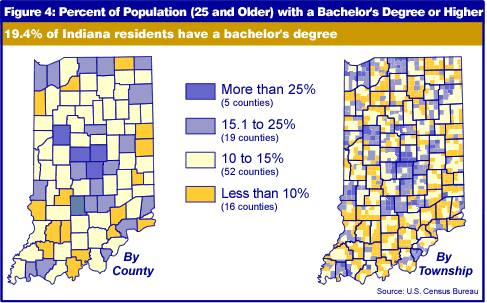
More than 80 percent of Hoosiers age 25 and older have at least a high school diploma (or equivalency) and 19.4 percent of them have earned a college bachelor's degree or more. On that measure, 17 counties in Indiana exceeded the state average for adults with a college education. Ten years earlier, only 15 counties met or exceeded the state average of 15.6 percent with a B.A. degree (see Figures 3 and 4).
Interest in this measure is significant because of its close association with earning power, as studies such as What Is It Worth by the Census Bureau have shown a direct correlation between earning power and educational attainment. For example, the national average monthly earnings of high school graduates in 1996 were $2,279, compared to $3,767 for those with a bachelor's degree.
Hamilton County is the most educated county, with nearly 50 percent of its adult population holding a B.A. degree or higher. Six of the most highly educated counties in Indiana are either part of the Indianapolis Metropolitan Statistical Area or another metropolitan area of the state.
Hamilton County was followed by Monroe County, where 39.6 percent of residents have a B.A. degree or higher; Tippecanoe County, 33.2 percent; Boone County, 27.6 percent; Marion County, 25.4 percent; St. Joseph County, 23.6 percent; Hendricks County and Johnson County, 23.1 percent.
Indiana's most educated township was Wabash, in Tippecanoe County, with 61.3 percent of its adults holding a bachelor's or higher degree. Tippecanoe and Monroe counties are home to Indiana's major public universities.
The designation for the most educated city or town in Indiana goes to North Crows Nest in northern Marion County, where all the adults 25 and older are at least high school graduates and 85 percent have a bachelor's degree or more.
The counties that made the greatest advances in educational attainment were Warren, Starke, Jennings, Scott and Crawford. These mainly rural counties are probably demonstrating an aging of the population with older, less well-educated persons dying or moving away.
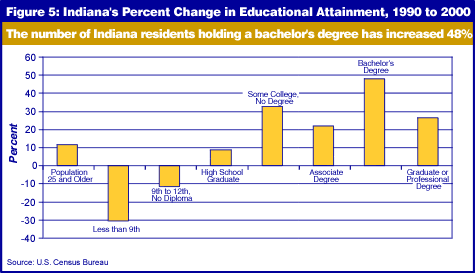
But is the focus on the B.A. degree masking other gains Hoosiers have made in furthering their education past high school? Census data show that 45 percent of adults in Indiana (25 and older, that is) have at least some college education, compared to 37 percent who stopped at a high school diploma (or equivalency).
That translates into 1.7 million Hoosiers who have:
- Some college, no degree-19.7% or
- An associate degree-5.8% or
- Completed a bachelor's degree-12.2% or
- Gone further and attained a graduate or professional degree- 7.2%
Between the censuses of 1990 and 2000, there was a 31 percent decline in the population that had less than a 9th grade education, signaling the end of the era when people bypassed high school altogether to work on the farm or at the local plant (see Figure 5).
Poverty Hits Home
The incidence of poverty in Indiana has declined since the last census in 1990. But, boom times of the 1990s notwithstanding, it didn't go away.
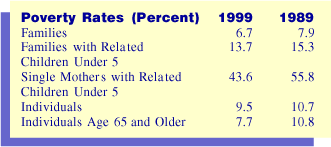
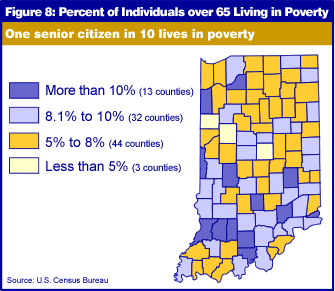
In 1999, more than 550,000 Hoosiers lived at or below the poverty line
and nearly 108,000 families lived in poverty. And of those families with children
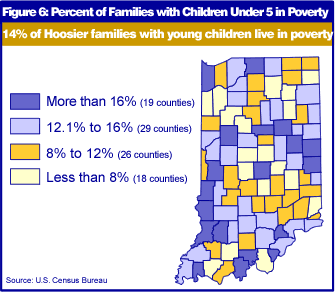
under 5 years of age, 13.7 percent were living in poverty. The most stark
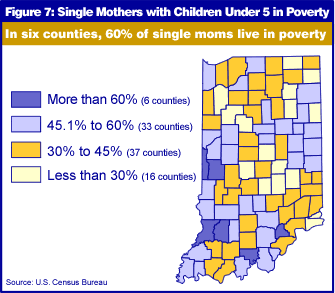
figure to come out of the poverty measures is that more than 40 percent of
children under 5 in single-mother families live in poverty.
The maps tell the story, showing the pockets of poverty throughout the state.
Notes
Income: "Total income" is the sum of the amounts reported separately for wages, salary, commissions, bonuses, or tips; self-employment income from own nonfarm or farm businesses, including proprietorships and partnerships; interest, dividends, net rental income, royalty income, or income from estates and trusts; Social Security or Railroad Retirement income; Supplemental Security Income (SSI); any public assistance or welfare payments from the state or local welfare office; retirement, survivor, or disability pensions; and any other sources of income received regularly such as Veterans' (VA) payments, unemployment compensation, child support, or alimony.
Poverty status in 1999: Poverty is measured by using 48 thresholds that vary by family size and number of children within the family and age of the householder. To determine whether a person is poor, one compares the total income of that person's family with the threshold appropriate for that family. If the total family income is less than the threshold, then the person is considered poor, together with every member of his or her family. Not every person is included in the poverty universe: institutionalized people, people in military group quarters, people living in college dormitories, and unrelated individuals under 15 years old are considered neither as ''poor'' nor as ''nonpoor,'' and are excluded from both the numerator and the denominator when calculating poverty rates.
| Staff at IU's Indiana Business Research Center, part of the Kelley School of Business, analyzed the newly released Census data. The center serves as the state's official liaison with the U.S. Bureau of the Census and has been working with the state and its localities to provide a full and accurate count in the 2000 census. Assistance in accessing the data is also available at the Indiana State Library, partner in the Indiana Data Center Program with the IBRC and the Indiana Department of Commerce. There are 58 affiliates statewide. |
The Gap Persists
Indiana women working full-time, year-round, earned 68 cents to the dollar compared to men, results from Census 2000 show. This isn't shocking news. Bureau of Labor Statistics research has found that in virtually all of the occupations for which data were available, women's median earnings are less than men's. Figure 9 shows national annual earnings for women and men working full-time, year-round from 1951 through 1999 in real dollars.
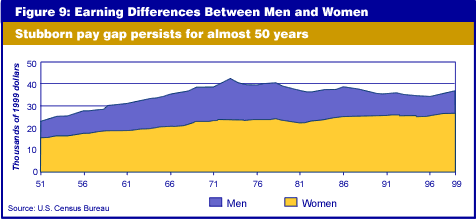
Results from Census 2000 for Indiana reveal two things: (1) the gap persists, but is growing smaller in many parts of the state and (2) women's median earnings for year-round, full-time work increased considerably between censuses. After adjusting the 1989 figures for inflation, 63 out of 92 counties had percentage increases for women that were 10 percent or greater. Ohio County's change was most significant, with a 40 percent increase. Only six counties saw an increase in male earnings by more than 10 percent. Keep in mind that the base earnings for women were smaller to begin with.
Census results for Indiana, compared to 1990, can be found at www.stats.indiana.edu/c2k_menu.html.
