How Indiana's Economy Varies with the Nation's
When the U.S. economy is climbing, it's reasonable to expect that an individual state's economy would climb as well, staying somewhat in sync with the national climate. The same synchronicity would be expected when the national economy is in decline.
But does this expectation translate into reality? Since 1970, the vast majority of state economies, including Indiana's, have moved up or down in correlation with the national economy most of the time. Only a small minority of states' economies have not mirrored national trends.
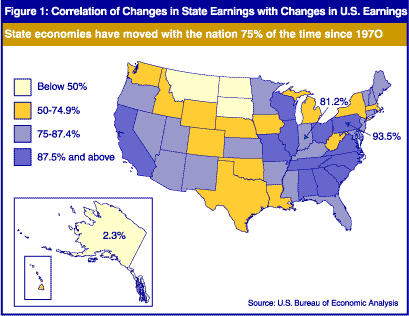
On average, state economies have moved with the nation's economy 75% of the time since 1970. In that same time period, Indiana's economy has moved with the nation's 81.2% of the time (see Figure 1). At 93.5%, Pennsylvania's economy has reflected the nation's movement more than any other state, followed by South Carolina (92.8%) and Virginia (91.1%).
Showing the least correlation with the nation's economy over the past 30 years is Alaska, whose economy has moved in tandem with the country's only 2.3% of the time. Alaska is followed at a considerable distance by North Dakota (38.8%) and South Dakota (47.8%).
Among Indiana's neighboring states, only Michigan's correlation percentage was lower than ours (74%). The economies of Illinois, Ohio and Kentucky were more in harmony with changes in the nation.
In this instance, the economy is measured by total earnings of those who work for themselves (proprietors) and those who work for others. Our measure of harmony or concurrence with the nation is the correlation coefficient between the annual percent change in earnings at the state level and the nation's percent change in earnings.
If earnings in Indiana grew and contracted at exactly the same rate as those in the U.S. as a whole, this measure would be equal to +100%. If there were no relation at all between Indiana and the nation, the value would be zero. Should Indiana expand and contract in a manner opposite but equal to the nation at all times, the value would be -100%.
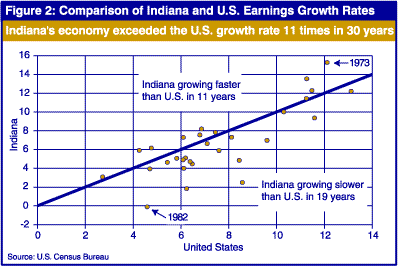
Figure 2 plots the number of times Indiana's rate of earnings has been greater or less than the U.S. rate. Indiana's economy exceeded the U.S. growth rate 11 times in 30 years (indicated on the graph by circles above the line) and fell below the national rate in 19 years. Indiana's best year relative to the nation was 1973, when Hoosier earnings grew by 15.2% and U.S. earnings grew by 12.1%. By contrast, the greatest negative difference was in 1982 when the nation advanced by 4.6% and Indiana had a 0.2% decline.

Manufacturing's Relationship to the General Economy
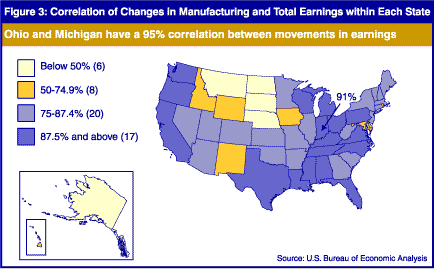
Which states have experienced the strongest correlation between manufacturing performance and overall economic performance since 1970? Ohio and Michigan lead the nation with a 95% correlation between movements in manufacturing earnings and total earnings within the state (see Figure 3). Oregon, Wisconsin and Alabama round out the top five, and Indiana ranks sixth at 91%. North Dakota and South Dakota, where agriculture dominates the economy, experience little correspondence between manufacturing and the overall state economy (19% and 27% respectively). Alaska, with its dominant petroleum industry, is sandwiched between the Dakotas at 24%. The national average is 91%.
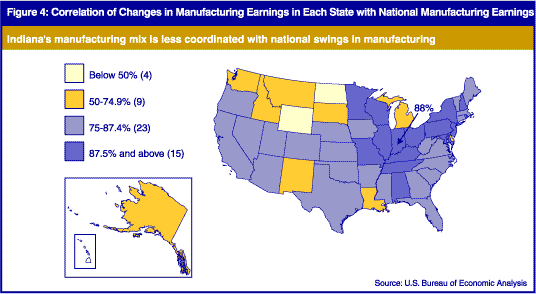
The correlation between manufacturing earnings in Indiana and the U.S. was 88%. Indiana ranks 12th in this measure while Ohio, Maryland and Minnesota lead at 94%. That Indiana is not among the leaders suggests that our particular mix of manufacturing is less coordinated with national swings in manufacturing earnings (see Figure 4).
Because Indiana is highly correlated with changes in the national economy, it can be expected that we will follow the pattern of the nation fairly closely in the recessionary and recovery periods now in progress. Manufacturing continues to play a major role in those cyclical movements


