Highs and Lows of High-Tech Occupations
High-technology employment is often used to indicate a state's success in the new economy. In the June 2000 issue of IN Context, we calculated high-technology employment in Indiana using three different classifications of industries considered to be high-tech. This article will calculate employment using occupation types rather than industries.
The U.S. Bureau of Labor Statistics (BLS) obtains occupational data at the state and national level through the Occupational Employment Statistics survey (OES). There does not appear to be an official classification of high-technology occupations—the classification used here is based on BLS reports on high-technology employment published in the Monthly Labor Review. In these reports, BLS focused on those occupations most often associated with research and development activities. This study takes a slightly broader view, including most engineers, scientists, computer specialists and single categories for specialty management and support. High-technology employment and average salary for 1998 are presented by major occupational groupings in Table 1.
Link to a list of the individual occupations identified as high-tech for this article.
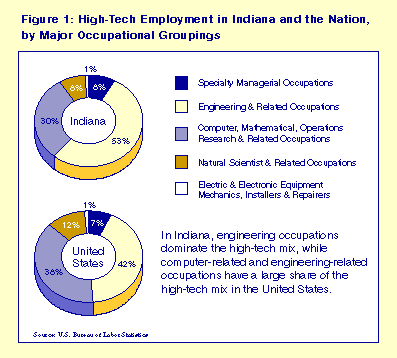
Engineering and related occupations employ the most high-technology workers in both Indiana and the United States, constituting 53% and 42%, respectively, of all high-technology workers. The pie charts in Figure 1 illustrate the structural similarities and differences between the distributions of high-technology employment in Indiana versus the nation. The highest-paid group of technology workers are employed in specialty managerial occupations as engineering, mathematical or natural-science managers. These managers earn, on average, $64,060 annually in Indiana and $71,840 nationally. Computer and related occupations is the second-largest grouping and pays the third-largest salaries in both Indiana and the nation.

In terms of total impact on the high-technology economy, engineering occupations stand out, given their number and relatively high wages. Assuming that each person employed as an engineer in Indiana makes the average salary of $48,960, this group adds more than $2.3 billion in income to the Indiana economy each year. Meanwhile, high-technology managers with their higher salaries contribute only $459 million. Similarly, in the United States, engineering occupations generate $110 billion in earnings, while high-technology managers generate $25 billion annually. The impact of engineering occupations is also greater in both Indiana and the nation than computer-related occupations, which contribute annual earnings of $1.2 billion in Indiana and $96 billion nationally.
In the context of the larger economy, high-technology employment constitutes just 3% of all employment in Indiana and 4% of all U.S. employment. Table 2 compares high-technology occupations to all occupations in Indiana and the nation in terms of both employment and wages. Indiana's share of national high-tech employment is lower than its share of total employment, and high-technology wages in Indiana are 7% lower than the U.S. average. Similarly, Indiana's average wage for all occupations is 94% of the national average. All wage averages used in this article have been weighted to take into account the size of each occupation.
In terms of single occupations, Indiana's largest high-tech employment group is "all other" engineers, followed closely by systems analysts (see Table 3). Computer programmers are the top employment group in the United States, also followed by systems analysts (see Table 4). In both Indiana and the nation, the top 10 occupations constitute approximately 75% of employment in all the high-tech occupations. Of these occupations, three in Indiana are also among the top 10 highest-paid technology occupations—engineering, mathematical and natural-sciences managers; all other engineers; and electrical and electronic engineers. In the nation as a whole, computer engineers also fall into both the top 10 largest occupations and the top 10 highest-paid occupations.
The next step to understanding high-technology employment is to look at both industry and occupations simultaneously. The Indiana Department of Workforce Development (DWD) has developed staffing patterns that show, for example, every industry employing engineers, or, looking at it from the opposite perspective, how many engineers are employed by a single industry, such as fabricated metals or transportation. This information can be found on DWD's new workforce statistics Web site at www.hoosierdata.in.gov.
