January Jobs Set Record in Indiana
Newly revised data released by the U.S. Bureau of Labor Statistics show Indiana's payroll employment climbed to 2,949,000 in January, a record for any January. That figure was about one-tenth of one percent higher than January 2000 and nearly 3% above the January 1999 level.
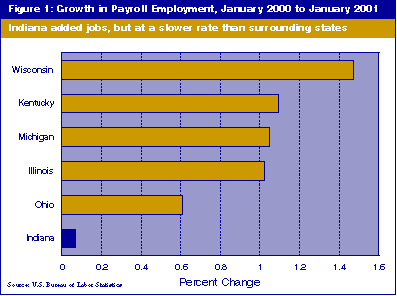
Indiana's year-over-year gain in nonfarm employment, however, trailed both the region and the nation as a whole (see Figure 1). Nationally, non-seasonally-adjusted job growth was 1.3% in January. In Wisconsin, the January job count was up 1.5% over the prior year; Kentucky and Michigan each posted 1.1% growth.
Among major industry categories in Indiana, the highest rate of growth in jobs (4.4%) came in the social services industry. This was also the industry with the highest growth rate nationwide (see Figure 2). The social services category includes child care and adult residential care, job training and individual and family services not classified as health care.
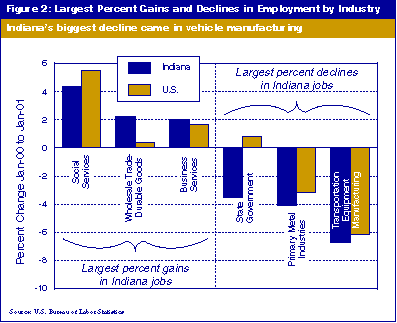
The other two biggest gainers in Indiana, among industries with at least 2% of all jobs, were wholesale trade in durable goods, up 2.2%, and business services, which increased just over 2%. Business services include personnel supply services and computer software design, as well as building maintenance.
Indiana employment in health services rose 1.6% in January over the prior year, and jobs at auto dealers and service stations increased 1.4%. Employment in the category for wood building and mobile home manufacturing was up 1.1% compared to January 2000.
Construction Jobs Increased in U.S., not in Indiana
In the U.S. as a whole, construction industries chalked up big gains in January, up 3.4% over the prior year. All major categories of construction rose nationwide, including both residential and nonresidential building construction. Indiana's construction industry was flat, though, coming in at about a one-half percent decline.
Another industry with large employment gains nationwide was engineering and management services. The category includes architects, accountants and management consultants and accounts for 2.7% of all jobs. January employment in the nation jumped 4.7% in this industry. In Indiana, the industry expanded by 4.8%, but it represents only 1.4% of Indiana employment. Consequently, small changes in the number of those jobs in this state create large percentage changes.
Manufacturing Employment Down but Still High
The industry with the greatest decline in employment in Indiana was transportation equipment manufacturing (see Figure 2). As layoffs hit many Hoosier auto plants, employment in the industry dropped 6.7% compared to January 2000. The national figure for the industry was a similar 6.2% dip.
Interestingly, however, employment in the industry in Indiana, at 121,000 statewide, remained well above the 117,400 January figure for the boom year of 1998 and approximately equal to that for January 1999.
All manufacturing industries in Indiana together recorded a 2.7% decline in employment.
State government employment was off 3.5% in Indiana, while that industry category rose by 0.8% in the nation.
Indiana Leads Region in Medical Instrument Manufacturing
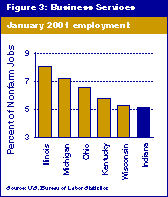
Despite the rapid growth in employment in business services in Indiana, the industry represents a smaller share of state employment than in any state in the Great Lakes region (see Figure 3). Of all nonfarm jobs in Indiana in January, 5.1% were in the business services industry. This compares to 5.8% in Kentucky and 8.1% in Illinois.
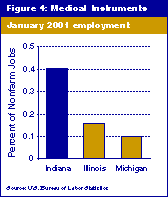
Indiana leads the region, though, in employment in medical instrument and supplies manufacturing (see Figure 4). The industry provides about 0.5% of Indiana jobs, more than twice the industry's share in second-place Illinois. Michigan recorded one-tenth of one percent of its jobs in medical manufacturing. Other states in the region had no significant employment in the industry.
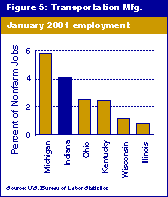
Indiana's role in the nation's auto industry came through in the January numbers (see Figure 5). With 4.1% of state employment in transportation equipment manufacturing, Indiana ranked second only to Michigan among Great Lakes states. Ohio and Kentucky trailed with about 2.5% each. The industry was but a minor factor in Illinois and Wisconsin.
January Data Revised for Accuracy
Every year in March, BLS issues revisions to the state employment data it produces in its Current Employment Statistics program (CES). Known as a benchmark revision, these new data incorporate a nearly complete count of payroll employment at the state level as of March 2000. The count is taken principally from state unemployment insurance tax reports that nearly all employers are required to file. The benchmark revision means that data for January 2001 are about as accurate as these numbers get. In subsequent months, BLS computes estimates of employment levels based on ratios found in a monthly sample of establishments.
Note that payroll employment reported in the CES numbers represents the number of jobs in the state, not the number of people working. A person working at two jobs will count twice. The total CES employment figure for the state, therefore, will differ from the employment numbers reported as part of the monthly unemployment statistics. Monthly unemployment statistics estimate the number of people working and not working, not the number of jobs in the state. The CES data also generally count part-time employment the same as full-time employment.
Although they do not show earnings from the various industries, the January data offer the most accurate and most current picture of the mix of employment in Indiana. Figure 6 shows how Indiana's employment structure compared to the nation as a whole in January 2001.
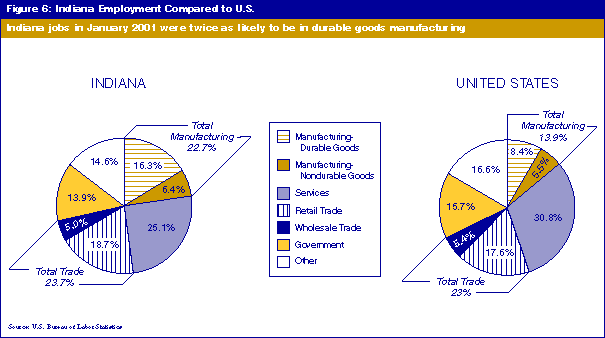
While services industries accounted for 30.8% of U.S. jobs, they provided just over 25% of Indiana jobs. Manufacturing generated nearly 23% of all jobs in Indiana, while those industries as a group dropped to only 13.9% of nationwide employment.
Indiana was similar to the nation in share of employment in retail and wholesale trade. Government employment in Indiana, at 13.9% of all jobs, was somewhat lower than the 15.7% of U.S. employment in government jobs.
The "other" category on Figure 6 includes employment in construction; mining; finance, insurance and real estate; and transportation and public utilities. Together these industry groups represented 16.6% of all jobs in the nation but just 14.6% of Indiana employment.
