Occupational Data: Where Do All These Numbers Come From?
It has not been a good day. You are the owner of an architectural firm, and your landscape architect just quit. Then this morning at the breakfast table, your teen-age son announced that he was skipping college to become a DJ. What are you going to do?
Let's look at finding a new landscape architect first. The employee who just quit was earning $19 an hour, just slightly below the estimated mean hourly wage for Indiana. There are only about 300 landscape architects employed in Indiana. So it could be a little tough finding one in the neighborhood. However, the national mean hourly wage is $21.40. It could also get expensive if you go out of Indiana to find one. Maybe you could do with less experience than before and be willing to hire a recent graduate. This could get the rate down to maybe $13 or $14 an hour.
Now about your son, the promising DJ - what are you going to tell him? The employment demand for announcers in Indiana is not so good. There were approximately 1,120 employed in 1998, but this is expected to decline to 1,090 by 2008. That does not seem like too big a drop, but the 1999 estimate was already down to 1,020. Prospects for future employment will require considerably more study.
What about wages? The mean hourly wage for announcers in Indiana is $10.41. In the bigger markets, like Chicago, the mean hourly rate is $19.49, but it costs more to live in Chicago. Anyway, your son would probably start in one of the smaller markets, like Lafayette, where the mean is $9.41. Of course, the starting wage will not be much more than minimum wage. These wages are a long way from what your son could make after graduating and entering the family business. Looks like some career counseling would be helpful (see Table 1).
Click on table to see larger version.

Indiana occupational employment and wage data: Where do all these numbers come from? The backbone of all occupational information in Indiana is the Occupational Employment Statistics (OES) survey. This is an annual mail survey conducted in Indiana by five labor market analysts employed by the Indiana Department of Workforce Development. These analysts contact more than 10,000 establishments each year to count employment and collect wage data for Hoosiers employed in more than 700 occupations in nonfarm establishments. The survey is actually a three-year endeavor, with one-third of the sample collected each year. This means the sample is really more than 30,000 establishments.
It is the sheer size of this survey that provides reliability to the data. Each single-year sample represents a one-third sample of both the certainty and non-certainty strata for the full three-year-sample plan. While estimates can be made from a single year of data, the OES survey is designed to produce estimates using the full three years of data. This allows production of estimates at fine levels of geography, industry and occupational detail, while also providing for significant sampling error reductions.
Combining multiple years of data has both statistical advantages and limitations. Significant reductions in sampling error can be achieved by taking advantage of three years of data, which cover more than 70% of employment in the nation. (All 50 states and the District of Columbia conduct this survey, making the data comparable from area to area.) This feature is particularly important in improving the reliability of estimates for small domains in the population. Starting with the 1997 estimates, the OES program has used the over-the-year fourth-quarter wage changes from the Bureau of Labor Statistics, U. S. Department of Labor's Employment Cost Index to adjust prior-year survey data before combining them with current-year data.
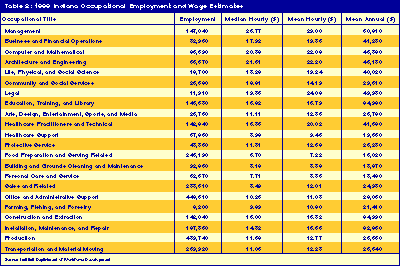
The OES survey has a new look. In 1999 the survey began using the Office of Management and Budget's new occupational classification system: the Standard Occupational Classification system. The SOC system is the first OMB-required occupational-classification system for federal agencies, which eliminates the need for crosswalks. The OES survey now uses 22 major occupational groups from the SOC to categorize workers in one of almost 770 detailed occupations (see Table 2).
Click on table to see larger version.

The occupational employment from OES becomes the base-year employment for the industry-occupational matrix from which occupational projections are produced. A broad spectrum of Indiana's occupational employment data is available on the Hoosiers by the Numbers Web site (www.hoosierdata.in.gov) utilizing four topics: Job Wages, Job Projections, Jobs by Industry and Industry by Jobs.
So what is the downside to the OES survey? It's a voluntary mail response survey. Although having good occupational data available makes good business sense, it is sometimes difficult to convey the importance of the survey to 30,000 employers. The task keeps those five labor market analysts busy all year long.
