Measuring Growth Momentum, Part II: Total Wages
Last month, we introduced a new measure of employment growth for Indiana industries that we called growth momentum (IN Context Vol. 2, Issue 5, May 2001). To calculate employment growth momentum for an industry during a specific time period, multiply the change in employment during the period (similar to mass) by the growth rate for that industry (similar to velocity). For industry sectors experiencing decline in employment the momentum is multiplied by negative one, resulting in negative momentum values for these sectors. The result is a simple employment growth momentum measure that incorporates both numeric change and percent change.
Let's apply the idea to total wages instead of employment. Now we are trying to identify high wage growth industries in the state: those that have experienced the largest growth in total wages paid between first quarter 1995 and first quarter 2000.
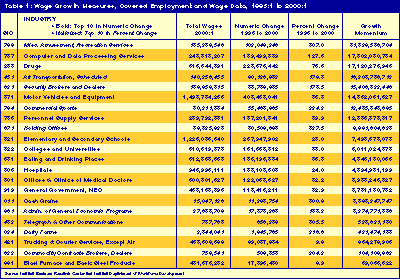
Table 1 illustrates total nominal wages for first quarter 2000, change and percent change in nominal wages between 1995 and 2000, and the growth momentum measure for a subset of industry sectors. The subset of sectors includes any industry that ranks in the top 10 in total wages, change in wages between 1995 and 2000, percent change in wages or growth momentum for wages.
Click on table to see larger version.

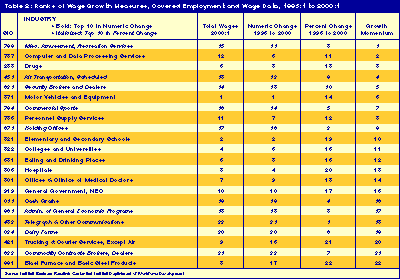
Table 2 contains the rankings for each growth measure for these industries. The industry sectors are listed in descending order of momentum in both tables.
Click on table to see larger version.

The top 10 sectors in terms of wage growth momentum have numeric wage growth figures that range from $30 million (holding offices) to $400 million (motor vehicles and equipment). Total wage growth rates range from 28% (elementary and secondary schools) to more than 300% (holding offices and misc. amusement and recreation services). Examples of the types of establishments found in each of the top 10 wage growth momentum sectors can be found in Table 3.
Click on table to see larger version

Using the same analogy as last month, each sector can be pictured as a snowball, growing as it rolls down a hill. The sectors that are experiencing the largest amounts of numeric growth in total wages paid are the ones that are adding the most snow. The sectors with the highest growth rates are moving the fastest.
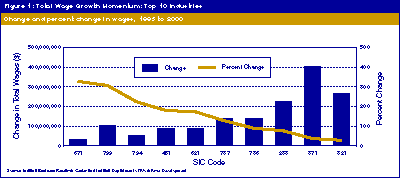
Figure 1 shows numeric growth and percent change in nominal wages between 1995 and 2000 for each of the top 10 wage growth momentum sectors. There appears to be an inverse relationship between change in wages and percent change in wages for these top 10 industries. The snowballs that are moving the fastest are not the ones that are adding the most snow.
Click on chart to see larger version.

Fastest-moving sectors are holding offices, misc. amusement and recreation services, and commercial sports. These sectors are smaller snowballs that are rolling quickly (total wage growth rates over 200%) but not adding the largest amounts of snow.
Sectors in the next group are not moving as quickly as those above, but are still experiencing total wage growth rates between 90% and 180%. These fast-moving intermediate size snowballs are scheduled air transportation, security brokers and dealers, computer and data processing services, and personnel supply services.
Large snowballs that are adding the most snow but moving more slowly are elementary and secondary schools, motor vehicles and equipment, and drugs. Each of these industries added at least $223 million to its payroll between 1995 and 2000. Growth rates are more moderate for these industries, between 28% and 77%, compared with 33% for the overall state average during the same time period.
Next month, we will conclude this three-part series with a look at top momentum industries with respect to both employment and wages. In other words, we will identify industries that have experienced high growth in both employment and total wages
