Older Age Groups Expanding Fastest
The recently released Census 2000 data on the age composition of Indiana's population invites analysis and some speculation.
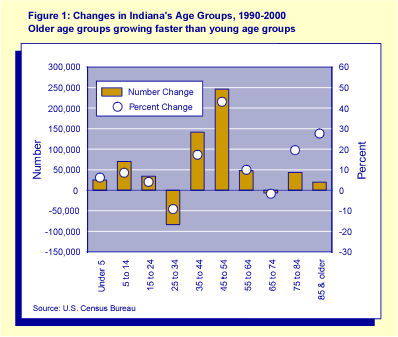
Figure 1 shows the changes in population by age group. The greatest change, both in number of people and percent change, was 246,000 (43%) in the 45 to 54 age group, those born 1946 to 1955. This was the great baby boom. The next youngest group, also part of that demographic surge, was born between 1956 and 1965. These Hoosiers were 35 to 44 years old in 2000 and represent an increase of 142,000 (17%).

However, if we examine the percentage changes, older Hoosiers also had impressive gains. Those 75 to 84 (born 1916 to 1925) grew by 20%, and those 85 and older (born 1915 and earlier) increased by 28%.
These changes help us understand many of the economic forces of the 1990s in Indiana. Greater pressure on the health care industry is one obvious consequence of the high growth rates for our older population. At the same time, these age groups have been influencing the housing market with increased demand for less time- and personal energy-consuming residences. Meanwhile, the growth of the population ages 35 to 54 has spurred development of larger homes, restaurants, and time-using activities (including leisure as well as commuting).
The casual observer might see in Figure 1 evidence of more out-migration by young Hoosiers between the ages of 25 to 34. But the 84,000 (9%) decline in this age group actually represents fewer births from 1965 to 1976 than in the 10 years preceding that decade.
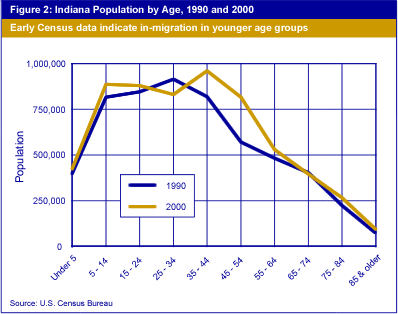
If one is looking at these data for migration indications, the most intriguing data are found in Figure 2. In 1990, Indiana had 915,000 people age 25 to 34. Normally, without migration, we would expect this number to fall, due to deaths. But by 2000, there were 961,000 people age 35 to 44 in Indiana. This increase of 46,000 can only be explained by net in-migration. (It is possible that the count in 1990 for people 25 to 34 was far worse than the count of people 35 to 44 in 2000, but this is unlikely.) Certainly, no one was born into this group in the last decade.

Likewise, the population age cohort 35 to 44 in Indiana in 1990 was 819,000 and declined to 817,000 people ages 45 to 54 in 2000. This small change (-2,000) also suggests net in-migration of adults to Indiana, as it is likely that this age group experienced more than 2,000 deaths over the decade. When we have full age-specific death data for the past decade, as well as migration data from Census 2000, more definitive conclusions can be reached.
Until then, it is tempting to believe that Hoosiers who left in the 1980s as young adults returned to their native state in the 1990s. Or perhaps the growth observed is in-migration of others who have found job opportunities or residential opportunities attractive in Indiana.
Domestic Migration Rebound in Indiana
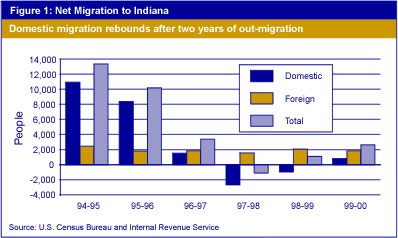
More people moved from other states to Indiana than moved from Indiana to other states between 1999 and 2000, according to IRS migration data. This turnaround followed two consecutive years of domestic out-migration: more people moving from Indiana to other states than moving from other states to Indiana.
In the early 1990s, Indiana attracted large numbers of new residents from other states. Then in the mid-90s, net domestic migration began to drop and actually became negative between 1997 and 1999 (see Figure 1). Data for the most recent year show that once again, the Hoosier state has gained more new residents than it lost to other states.

International in-migration to the state remained steady in the '90s. Indiana has consistently gained population in the most recent decade due to migration from foreign countries.
Where are they coming from and where are they going?
Illinois topped both lists of states sending people to and receiving people from the Hoosier state. Indiana gained more residents from Illinois than it lost to its western neighbor and also experienced net gains in resident exchanges with Ohio, California, New York, Kansas and Pennsylvania.
Florida attracted large numbers of Hoosiers, making it the leader in net out-migration from Indiana. Other states that gained more residents from Indiana than they lost to Indiana were: Georgia, Tennessee, Arizona, North Carolina and South Carolina and Michigan.
Indiana swapped large numbers of residents with Kentucky and Texas but with little net change. In other words, in and out migration between these states and Indiana ran about even.
