Indiana's school-age population projected to decline

Indiana's new population projections show that the size of Indiana’s school-age population is expected to decline by more than 105,000 residents by 2060—a 5.9% drop.
After growing by 10% between 1990 and 2010, the size of Indiana’s population under the age of 20 dropped by nearly 2% last decade. Losses in this age group were widespread, with 75 of the state’s 92 counties showing a decline between 2010 and 2020.
This trend—which is largely driven by the years-long slide in the annual number of births—will continue over the coming decades if recent fertility and migration rates hold steady. In fact, our new population projections show that the size of Indiana’s school-age population is expected to decline by more than 105,000 residents by 2060—a 5.9% drop (see Figure 1).
Figure 1: Indiana population under age 20
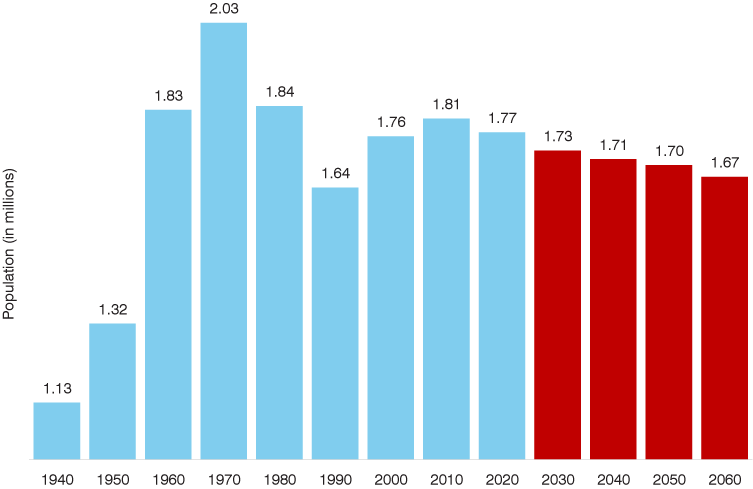
Notes: Blue columns are actual data while red columns are projections. 2020 value is from the vintage 2022 population estimates.
Sources: U.S. Census Bureau and Indiana Business Research Center
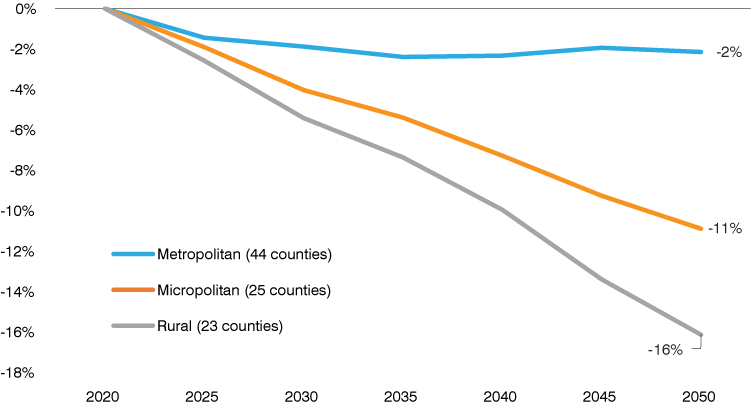
The state’s midsize and rural communities will likely see the sharpest declines in this age group. As Figure 2 shows, the school-age population in rural Indiana is projected to fall 16% by 2050.1 Similarly, the state’s midsize communities—or micropolitan areas (meaning counties with a city or town that has a population between 10,000 and 50,000 residents)—will have an 11% drop. The 44 Indiana counties that are part of a metropolitan statistical area will combine for a comparatively slim 2% decline in this age group over the same period.
Figure 2: Projected cumulative change for population under age 20 by county type
Source: Indiana Business Research Center
All told, only 12 Indiana counties are projected to see growth in this age group between 2020 and 2050. Suburban counties in the Indianapolis metropolitan area will lead the way—with Boone, Hamilton, Hendricks and Hancock counties each expected to see their school-age populations expand by more than 20% over the next three decades. Outside of central Indiana, other communities projected to see this group grow include Bartholomew, Daviess, Clark and Wells counties.
Use the following interactive data visualization (Figure 3) to learn more about projected changes to school-age populations in Indiana counties.
Interactive Figure 3: Projected change for population under age 20 by county
Source: Indiana Business Research Center
Potential impacts of declining school-age populations
These trends in school-age population will have far-reaching implications for the state if they play out as projected. The first and most obvious impact will be on school enrollments, with the latest projections from the National Center for Education Statistics showing Indiana’s total public school enrollment falling by 1% between 2021 and 2031.2
While we don’t have enrollment projections at the local level, recent trends suggest many Hoosier communities will see far more dramatic shifts. For example, between 2013 and 2023, 64 Indiana counties saw a decline in total K-12 enrollments (note: this measure includes both public and private school enrollment). Nearly half of these counties saw enrollments drop by more than 10%.
Narrowing the focus to younger grade levels, total enrollment in grades K through 6 fell in 72 counties over this same period, with 36 counties showing double-digit declines (see Figure 4). If this trend continues to gain momentum, more and more Hoosier communities will face the difficult decisions that accompany dwindling enrollment.
Figure 4: Change in total enrollment in grades kindergarten through 6, 2013 to 2023
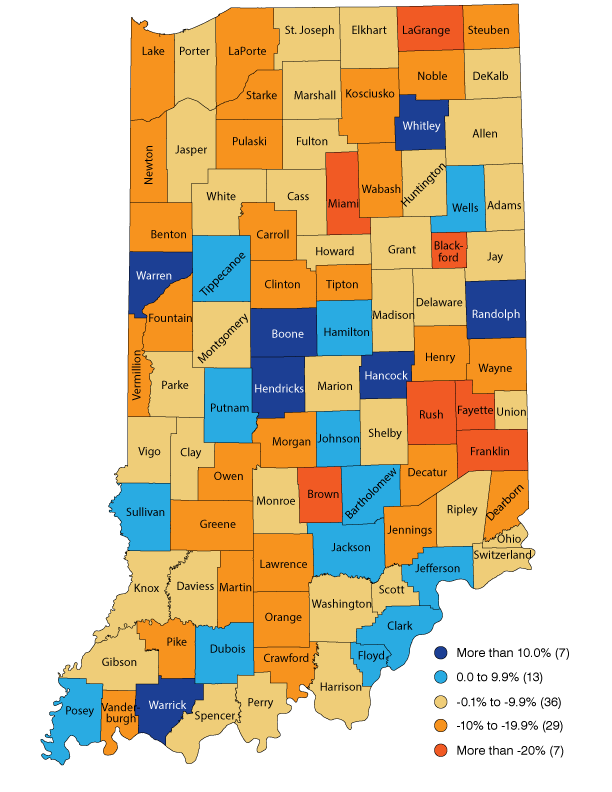
Notes: Enrollment totals include both public and private schools. Enrollments in Randolph and Clark counties include new online schools that have opened since 2019.
Sources: Indiana Business Research Center, using data from the Indiana Department of Education
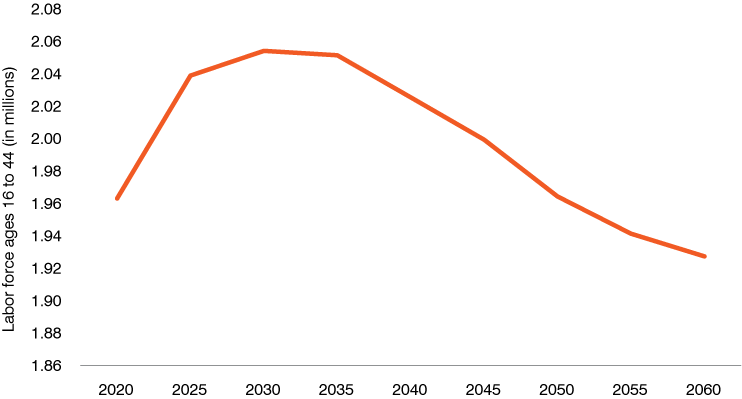
Of course, today’s students are tomorrow’s workers, and these trends could soon impact Indiana’s labor market. According to our latest labor force projections for the state, the number of Hoosier workers between the ages of 16 and 44 will continue to grow this decade before then declining 6% over the next three decades (see Figure 5).
Figure 5: Projected size of Indiana labor force between the ages of 16 and 44
Source: Indiana Business Research Center
Additionally, Indiana will see increased exits from the labor force over this same stretch as the Baby Boom generation ages (the youngest baby boomers will be 66 in 2030). As a result, our projections show that Indiana is set for a significant slowdown in total labor force growth over the next three decades before beginning to see a decline in this measure after 2050. These labor force shifts could have negative consequences for Indiana’s economy and the fiscal health of state and local governments.3,4
Looking big picture, Indiana is set for a dramatic realignment in the age structure of its population. As recently as 2010, the state had more than twice as many residents under the age of 20 than over 65. By 2060, these age groups will be nearly equal in size (see Figure 6). Over the next few decades, generating and allocating resources for a population that could soon have nearly as many seniors as it does youngsters will be a defining challenge for the state.Figure 6: Share of Indiana population by select age groups
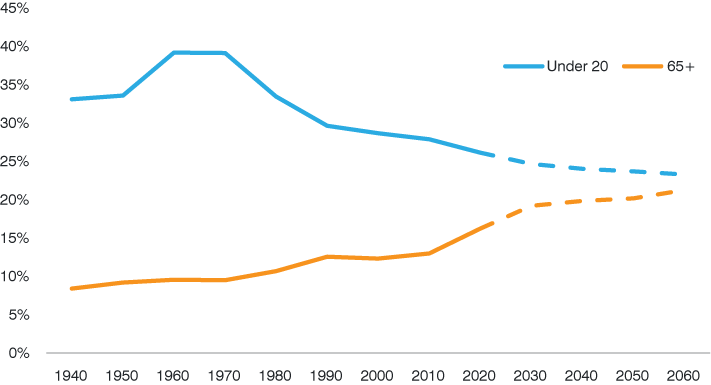
Note: Dashed lines represent projected values.
Sources: U.S. Census Bureau and Indiana Business Research Center
About the projections
The IBRC’s projections are purely demographic, meaning that they rely exclusively on recent birth/death data and migration estimates. Therefore, these figures reflect what Indiana and its communities will look like if past trends continue. No assumptions have been made about future economic conditions, land use decisions or environmental changes. However, State policy will assuredly have an effect, as will the decisions of individual residents and businesses.
Also, some population dynamics can be difficult to project. Migration, in particular, is prone to sudden swings. Therefore, long-range projections can be subject to significant error, and it is often useful to pay greater attention to trends during the first 15 to 20 years of the projections period.
To access the entire population projections data set or to read a detailed methodology, visit the STATS Indiana Population Projections topic page.
To view the Indiana Business Research Center’s labor force projections, visit Hoosiers by the Numbers.
Notes
- County-level projections cover 2020 to 2050. In this article, “rural” refers to any county that is not designated as being part of either a metropolitan or micropolitan statistical area by the U.S. Office of Management and Budget.
- National Center for Education Statistics, 2022 Digest of Education Statistics, Table 203.20, Enrollment in public elementary and secondary schools, by region, state, and jurisdiction: Selected years, fall 1990 through fall 2031, https://nces.ed.gov/programs/digest/2022menu_tables.asp.
- Melissa Kearney and Phillip Levine, “The causes and consequences of declining U.S. fertility,” Economic policy in a more uncertain world, Aspen Institute, January 2023.
- Jeff Chapman, “The long-term decline in fertility—and what it means for state budgets,” Pew Trusts Issue Brief (December 5, 2022), www.pewtrusts.org/en/research-and-analysis/issue-briefs/2022/12/the-long-term-decline-in-fertility-and-what-it-means-for-state-budgets.
