Did the COVID-19 pandemic change domestic or international sources of foreign direct investment?
Part 2 of the Indiana FDI series

Investments from Japan—Indiana’s leading source of international FDI—increased during the pandemic, despite a longer-term downward trend.
As we mentioned earlier this year, international trade was severely affected by COVID-19, with many expected and unexpected ripple effects.
In January, we initially explored the question about whether firms may have been more apprehensive to invest, and hence scaled back their investment announcements in Indiana.1 Over the last two years, FDI did not collapse. In fact, FDI announcements held up fairly well. Our tentative conclusion, based on the expected jobs and the expected dollars of capital investment destined for Indiana, is that the pandemic had a minimal effect so far.
That said, someone may retort that we looked at FDI trends based on industry sectors. There may be other interesting patterns based on the country source of investment, and those patterns may not be reflected in the sector data.
These data tell a generally benign story, neither a blockbuster, against-all-odds narrative nor a sad story of widespread dread.
As mentioned in the previous article, there are some important procedural points. As a reminder, the data source is fDiMarkets, a vendor for data on FDI announcements. These data are not actuals. The data do not reflect the completion of the actual investment or the number of jobs created because of the investment. The fDiMarkets data are investment intentions. These are not official federal statistics on foreign ownership of establishments within the U.S. Those latter data (which are organized differently than fDiMarkets) are available with some time lag, from the U.S. Bureau of Economic Analysis.
Another “reader beware” is that we are using the same data set used for the January issue, so it does not include announcements made in November or December of 2021.
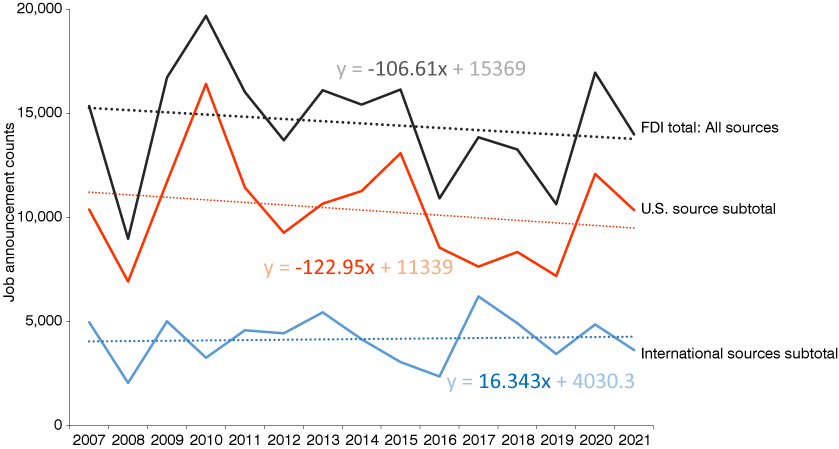
Whereas in the previous article we presented findings based on industry sector, here we tease apart the country sources of the investments. The reader should note that the sources of FDI in this fDiMarkets data set include not only all foreign countries, but also other U.S. states and territories. In essence, FDI reflects funds from outside the state’s borders and jobs created that were not in the state before. Figure 1 shows job counts for total FDI, as well as its domestic and international components. The trend lines for total FDI and domestically sourced FDI have slightly negative slopes, whereas internationally sourced FDI has an almost imperceptible positive slope. The FDI data series show great volatility, but just the same, it appears that investment from overseas is holding up better.
Figure 1: Indiana’s FDI announced job counts by international and domestic sources

Note: Dotted lines indicate the linear trend lines.
Source: fDiMarkets
Investment by country
The natural follow-up question is: Where are these internationally sourced investments coming from? We looked at the top 10 countries contributing to investments and jobs over the last 15 years (2007 through 2021).
Table 1 presents the top 10 countries, together with the balance of all other countries investing in Indiana over the last decade and a half. We present several data items of interest, but merely the last five years in order to reduce table-induced eye-strain. The table is sorted alphabetically and country name is followed by its Indiana job total rank in parentheses.
Table 1: Leading sources of international investments—Top 10 countries by total jobs, 2007 to 2021
| Country (and rank) | Col. 1 | Col. 2 | Col. 3 | Col. 4 | Col. 5 | Col. 6 | Col. 7 | Col. 8 | Col. 9 |
|---|---|---|---|---|---|---|---|---|---|
| 2017 | 2018 | 2019 | 2020 | 2021 | 15-year job announcement total |
15-yr trend (slope) |
5-yr trend (slope) |
Ratio: 2-yr / 5-yr |
|
| Canada (4) | 180 | 0 | 535 | 53 | 33 | 4,781 | -28.6 | -24.1 | 0.27 |
| China (10) | 576 | 517 | 80 | 0 | 8 | 1,536 | 10.9 | -165.3 | 0.02 |
| France (7) | 144 | 0 | 367 | 57 | 0 | 3,201 | 2.6 | -23.1 | 0.25 |
| Germany (2) | 280 | 404 | 490 | 289 | 261 | 6,003 | -20.1 | -15.3 | 0.80 |
| India (5) | 2,645 | 1,500 | 0 | 102 | 37 | 4,334 | 52.3 | -661.4 | 0.08 |
| Italy (8) | 41 | 25 | 38 | 78 | 230 | 2,458 | -10.0 | 43.1 | 1.87 |
| Japan (1) | 1,432 | 1,128 | 189 | 717 | 1,691 | 20,044 | -22.4 | 10.7 | 1.17 |
| Switzerland (6) | 477 | 100 | 250 | 134 | 259 | 3,403 | -8.3 | -40.2 | 0.81 |
| Taiwan (9) | 0 | 0 | 58 | 0 | 0 | 1,779 | -42.0 | 0.0 | - |
| United Kingdom (3) | 143 | 235 | 283 | 1,547 | 279 | 4,817 | 18.3 | 158.4 | 1.84 |
| Top 10 countries announced jobs total | 5,918 | 3,909 | 2,290 | 2,977 | 2,798 | 52,356 | -47.3 | -717.2 | 0.81 |
| Balance of countries, announced jobs | 290 | 1,013 | 1,154 | 1,885 | 834 | 10,060 | 63.6 | 196.0 | 1.31 |
| International sources total, announced jobs | 6,208 | 4,922 | 3,444 | 4,862 | 3,632 | 62,416 | 16.3 | -521.2 | 0.92 |
| U.S. sources FDI, announced jobs | 7,641 | 8,343 | 7,195 | 12,090 | 10,354 | 155,324 | -123.0 | 917.3 | 1.23 |
| Jobs announced, total FDI | 13,849 | 13,265 | 10,639 | 16,952 | 13,986 | 217,740 | -106.6 | 396.1 | 1.13 |
Note: Only the most recent five years are shown as individual columns.
Source: fDiMarkets
It is impressive that over the last 15 years, Indiana has been graced with over 62,000 new jobs due to international investments and over 155,000 jobs from investments from other locations in the U.S. Recall that these totals are based on announcements. Counting heads at each establishment or place of business where the investment occurred is the only way to verify the figures, which is well beyond the scope of this article.
It would surprise few Hoosiers that Japan is the country leading the FDI totals, with Germany, the U.K. and Canada following at a considerable distance. While not shocking, it is mildly surprising that India is so well represented, at least in terms of the 15-year totals. There were announcements of significant size in 2017 and 2018, but other years were small to non-existent for India-sourced investment announcements. In a similar fashion, Taiwanese companies announced a large investment in 2007 but virtually nothing after that. Most announcements by companies from the People’s Republic of China—which we will refer to simply as China—were tiny or non-existent over the 15-year period, except for 2017 and 2018.
Based on the slope of the 15-year trend line, only China, France, India and the U.K. are positive. And of this “positive” lot, only the U.K. has shown a positive increase over the last five years. Even more recently, during the fallout of COVID-19 in 2020 and 2021, the U.K. appears to have maintained a positive movement, along with Italy and Japan as evidenced in column 9. (Column 9 is the two-year average of columns 4 and 5 divided by the five-year average of columns 1 to 5 to see if the most recent two-year average outpaces the performance over the last five years.)
As a group—and a group of smaller, intermittent investors—the “balance of countries” have been gaining altitude with respect to investments and job announcements in Indiana. Both the 15- and the five-year trends are resolutely positive. The ratio of the two-year to five-year is also strongly positive, but this may be the phenomena of the law of small numbers driving the positive outcome.
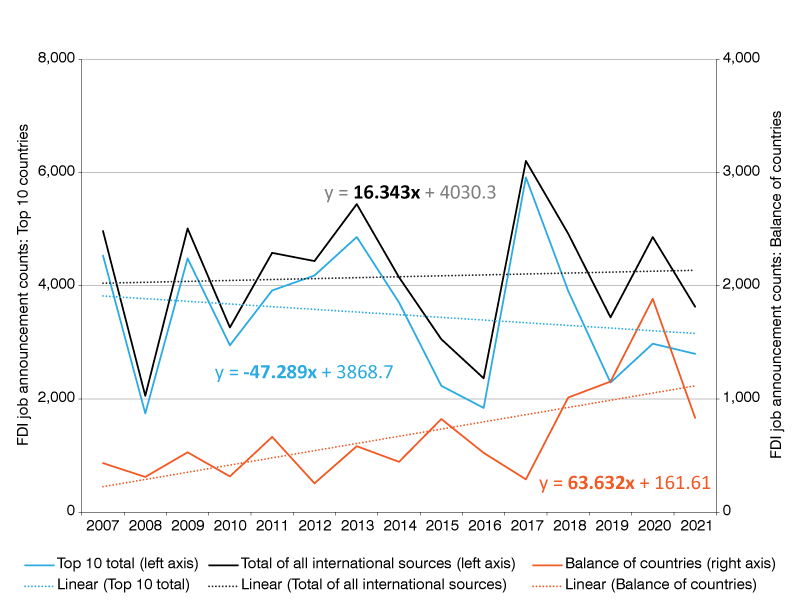
Figure 2 may provide a better sense of the contribution of the balance of countries over time. The general trend for the smaller, “balance of countries” investing in Indiana is positive while the trend for the top 10 country collective has trended slightly negative.
Figure 2: Job announcement trends of international sources of FDI to Indiana

Source: fDiMarkets
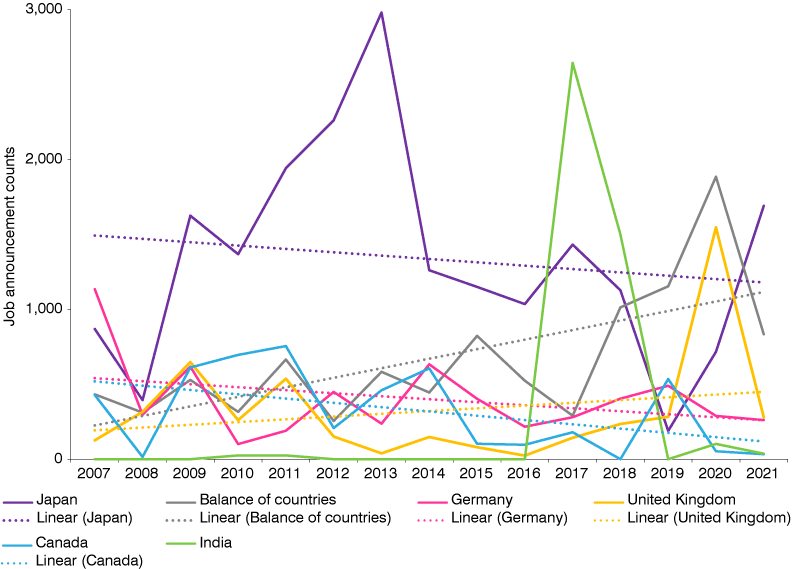
Figure 3 provides a sense of the trends for the leading sources of FDI. Japan, the largest source of Indiana FDI, has been on a soft downward trend. Japan has company, however: Germany and India. The latter may not be a fair comparison because India had a huge two-year surge in 2017-18 and then, for all graphical and statistical purposes, dropped to zero. The U.K. has a slight trend line uptick from 2007 to 2021, as shown by the dashed, gold line in Figure 3. The balance of countries category, on the other hand, has had a more robust increase in FDI announcements over the last 15 years. It is difficult to form a hypothesis for why this is the case.
Why would a loose collection of smaller and dissimilar countries taken together be interested in investing in Indiana? For any particular year and source country, the expected FDI jobs were not trivial, just not consistent. For any individual year between 2017 and 2021, the following members of the balance-of-countries (with the announced jobs in parentheses) include: Mexico (665), Netherlands (515), Hong Kong (450), Sweden (435), Brazil (346), Ireland (325), Belgium (253) and South Korea (210). Note that Hong Kong investments are tracked separately from China within the fDiMarkets data.
Figure 3: Trends of top five international FDI sources to Indiana

Note: The India trend line is intentionally not displayed.
Source: fDiMarkets.
Investment during the pandemic
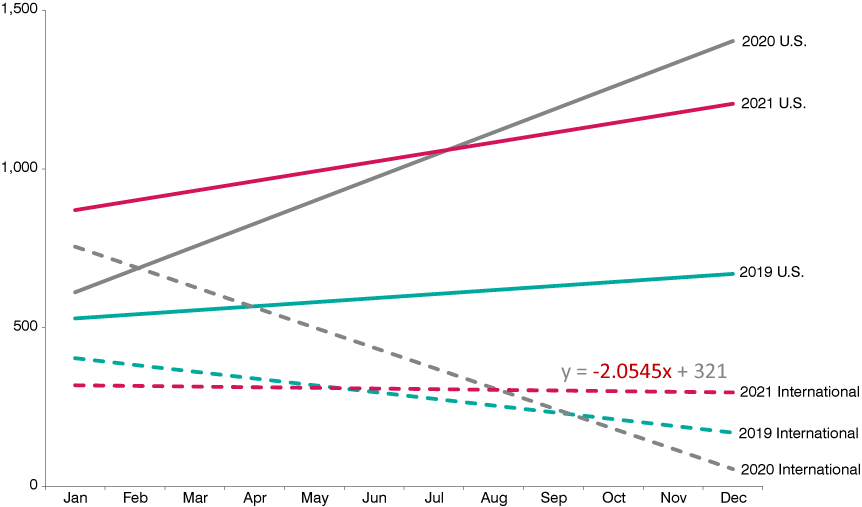
In keeping with our focus on how the pandemic may have affected announced (intended) and, by extension, future (realized) FDI, Figure 4 may address our potential concern and hypothesis that all the lockdowns, cancelled travel and companies contending with supply chain and labor disruptions would have had an impact on anticipated FDI announced for Indiana. Figure 4, which plots trend lines by month for 2019-2021, may not be the most elegant of graphs, but it does remove the busy clutter of the jagged data points associated with monthly FDI job data. If the hypotheses is that the pandemic significantly influenced FDI, then we would expect to see unambiguous declines and large negative slopes as investors stepped away from an uncertain investment environment. We would expect to see drop-offs and severe changes in slope between 2019 shown in teal and the years of 2020 (gray) and 2021 (red).
Figure 4: Linear trend lines for job announcements by month, U.S. and international sources, 2019-2021

Source: fDiMarkets
The dashed lines represent the international sources in 2019 (teal), 2020 (gray) and 2021 (red), while the solid lines represent the U.S. sources in 2019, 2020 and 2021. Domestic U.S. sources were on an overall upward trend. (Recall that the 2021 data are incomplete (without November and December), so the missing values for the two final months of the year do not enter into the calculation of the trend line in 2021). In the years of 2019 and 2020, the international sources show a soft decline, and COVID-19 was not relevant economically in 2019. For international FDI in 2021, there was an ever-so-small negative slope (as quantified by the negative beta of minus 2.05 for the regression equation as shown in red text). Given the small beta, it would be difficult to make an aggressive argument that the pandemic had an impact on FDI announcements in 2021.
There wasn’t a decline in U.S.-based FDI announcements. If, for example, 2020 started off like gangbusters and dropped precipitously toward the end of the year, we could speculate that COVID-19 had an impact. Lower than expected announcements in 2021 would also suggest that the pandemic would have long-lasting, years-long, effects on Indiana employment in general and FDI-related activities in particular. We see neither instance in the U.S. data.
Conclusion
Our question about whether the COVID-19 pandemic impacted FDI job and capital expenditure announcements has been largely answered: It does not appear so for the state of Indiana. The cancelled flights and lockdowns and social distancing interrupting the work of site selectors kicking Indiana dirt and doing the regional, sub-state data analytics for the better locations to invest didn’t really impact the numbers for 2020 and 2021.
Another key takeaway is that several of Indiana’s more consistent and significant international sources of FDI have been on a slight downward trend over the last 15 years. The less consistent and smaller international sources have, when taken together, been growing and even made up for the slight deceleration in U.S. and international sources over the last decade and a half.
But time frame matters! Over the last five years, there has been an upward trajectory for the balance of countries, U.S. sources and the overall total.
This outcome may point to an unambiguous positive: Hoosier attraction of FDI may be becoming more diversified. Traditional FDI sources have fueled notable job gains in the early 21st century, but it would appear that new sources of FDI will find a home in Indiana as well.
Another interesting research question may be determining whether COVID-19 constraints, obstacles and setbacks affected all the states the same as Indiana. Did other Midwestern states suffer relative to Indiana? With the right incentives—site selectors and economic development practitioners working in the business attraction space know all about incentives—our center would be happy to conduct such an analysis.
Notes
- Timothy Slaper, “Has the COVID-19 pandemic affected foreign direct investment in Indiana?”, InContext, January-February 2022, https://www.incontext.indiana.edu/2022/jan-feb/article1.asp
