Has the COVID-19 pandemic affected foreign direct investment in Indiana?
Part 1 of the Indiana FDI series

The recent Indiana FDI announcement story is good news and bad news.
International trade has taken a beating over the last two or more years thanks to disputes with China and especially the disruptions with global supply chains associated with the COVID-19 pandemic. Like human history, the pandemic is just one darn thing after another.
While COVID-19 will eventually burn itself out, one wonders whether the business decisions made during the pandemic will have longer-run consequences. More specifically, did firms pull back from their foreign direct investment (FDI) commitments and decisions? And if they did, how did the state of Indiana do? Over the last two years, did announced (meaning future or to be realized later) new plant and equipment greenfield investments get scaled back due to economic and market uncertainties associated with the fallout of COVID-19?
Given that an update on FDI in the Hoosier state was overdue, we decided to answer that question, as well as provide more analysis of FDI in the state in future InContext issues this year.
The recent Indiana FDI announcement story is good news and bad news.
The good news: First, since 2017, overall announced jobs due to greenfield investments—new plant and equipment—and expansions have been trending gently up through 2021. Second, the pandemic did not seem to influence this general trend.
The bad news: Over the last 15 years, there has been a slight downward trend in FDI announcements of both jobs and investment in plant and equipment, and the trip downhill has been bouncy. Many of the dominant, and if one may say “classic Indiana,” industry sectors have been trending down during this time frame.
Before getting to the data and graphs, a couple of housekeeping notes: The first is that the data source is fDiMarkets, a vendor for data on FDI announcements. The critical term is announcements. These data are not “actuals.” The data do not reflect the completion of the actual investment or the number of jobs created because of the investment. The fDiMarkets data are investment intentions that were announced in the news or in company press releases but may not be accurate in scale (a large investment could become a smaller investment) or existence. These data are not official federal statistics on foreign ownership of establishments within the U.S. that are available, with some time lag, from the U.S. Bureau of Economic Analysis.
Additionally, the fDiMarkets data use different definitions of industries than the North American Industry Classification System (NAICS). The NAICS is organized based on production of goods and services (not the consumer of goods and services). The fDiMarkets industry classification of “sectors” may be something of a blend of production-based and consumer-based definitions. For example, Amazon is usually considered electronic distribution (NAICS 4541), but the fDiMarkets sector to which Amazon is assigned is consumer products, with the business activity of logistics, distribution and transportation. In short, the reader will not be able to find the codes or the titles of the NAICS with which one may be more familiar or, for that matter, a straightforward crosswalk between the two classification systems. In some cases, this matters considerably. From 2007 through 2021, Amazon announced it would create over 13,000 jobs in Indiana. But despite a sector for transportation and warehousing in the fDiMarket rubric, those jobs are attributed to another sector—consumer products.
The reader should take note that the sources of FDI in this fDiMarkets data set include not only all foreign countries, but other U.S. states and territories as well. Hence, Amazon being based in Seattle and building fulfillment centers in Indiana is considered “FDI” because it reflects funds from outside the state’s borders and jobs created that were not in the state before.
Another “reader beware” is that the 2021 data isn’t complete. It does not reflect announcements made in December 2021 based on the download of the fDiMarkets data in early January 2022.
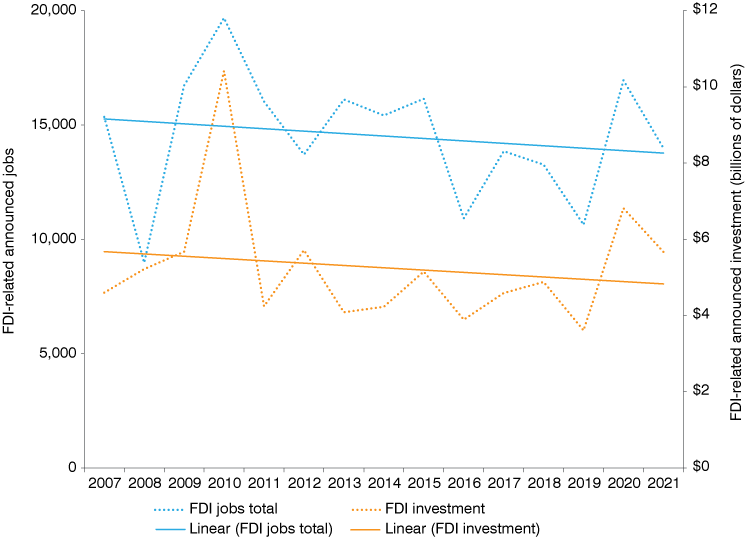
Over the last 15 years, there has been a slight downward trend in FDI announcements of both jobs and investment in plant and equipment, although the trip downhill has been bouncy. (These data, shall one say, are erratic.) Figure 1 shows the modest downward slope of total jobs. The trend lines are overly sensitive to the investment spike in 2010, the subsequent drop in 2011 and then again the rise in 2020 and fall in 2021. It looks like, in the aggregate, there was a fall in 2021. We have seen this pattern and movie before and, as a result, it would be difficult to make a case that there was an unambiguous drop during the COVID-19 years of 2020 and 2021, at least in the aggregate.
Figure 1: FDI announced job counts and investment expenditures, foreign and domestic sources, in Indiana

Source: fDiMarkets
The aggregate doesn’t tell the whole story, however. One sector may have been overly affected by the pandemic, while other sectors may have been in stable FDI decline over time. There may be some rising stars that might be obscured in the aggregated data as well.
Table 1 provides summary metrics on the larger sectors in the state—the top 15. (We cheated a bit by including pharmaceutical and medical devices in the top 15 as they didn’t technically make the cut but are considered to be critical, leading technology industries in the state.) It would come as little surprise to the average Hoosier that two automotive sectors—components and assembly/OEM—would be in the top three. Were it not for Amazon and its large and consistent investments, those two traditional “classic Indiana” sectors would have been the top two.
The table shows the cumulative proportion of the total number of jobs these 15 sectors contribute to new FDI jobs (see Column 9). Automotive components, consumer products and automotive OEM account for one-third of the new FDI jobs in the state. The table also shows that the top 10 sectors account for 70% of FDI jobs. Over the last five years, those three top sectors have a positive “beta” or slope, meaning that despite the longer 15-year span of negative trend for the two auto sectors, their last five years show an uptick. (See Column 10 that shows the positive average growth in bold and negative in gray.) The Indiana mainstays of transportation and warehousing and plastics also trended upward over the last five years. In the same column, one sees that the highly positive communications value is driven by a large value in 2020. Remaining with this column, one sees positive values for both pharmaceutical and medical device industries. Note, however, that there were no values for either sector reported in 2021—the notion of reported is key because those in the business may have been so frantically attending to developing, producing and distributing products needed for the pandemic that press releases and ribbon cutting were not their top priority. All that to say, the five-year values for these two sectors may not be trustworthy.
The recent five-year trends do not necessarily follow the last 15 years. The ones that do include consumer products, transportation and warehousing and communications. Automotive components, automotive OEM, plastics, pharmaceuticals and medical devices show a longer-term downward trend, even though the more recent five-year trend appears more promising. The reverse is true for software and IT services, as well as food and beverages. In those sectors, the last five years have under-performed compared to the 2007 to 2021 timeframe.
Column 13 (“2-yr / 5-yr average”) will help to dispel notions that the pandemic may have dampened FDI interest in Indiana. The column uses averages of 2020 and 2021 as the pandemic years and compares those averages with the 5-year averages for the same sector. If the 2-year average is lower than the 5-year (or more recent experience) average, one may make a claim that firms retreated from investing in greenfield and plant and equipment. But one can’t make that claim across the board.
In fact, one might assert that a deeper investigation of the topic is in order given that several sectors—automotive components, consumer products, automotive OEM, food and beverages, metals, plastics, communications, and pharmaceuticals—have attracted more FDI attention and announcements in the last two years, on average, than they had in the previous five. The question is why? Well before COVID-19, were the auto sector firms retrenching their supply chain after the trade dust-up with China? Or were state pharmaceutical firms expanding capacity with investments during the COVID-19 breakout and those announcements registered on the fDiMarkets data sweeps? (Even with a blank or zero value in 2021 for pharmaceuticals, it still shows a positive two-year average compared to the five-year average.)
To directly answer the question in the title: One cannot find unassailable evidence that the pandemic had an impact upon planned and announced investments in the state. Nevertheless, it cannot be comforting to economic developers and state officials to see the downward trends in FDI over the last 15 years.
Table 1: Sector summary statistics and general growth and decline metrics
| Col 1 | Col 2 | Col 3 | Col 4 | Col 5 | Col 6 | Col 7 | Col 8 | Col 9 | Col 10 | Col 11 | Col 12 | Col 13 | Col 14 |
|---|---|---|---|---|---|---|---|---|---|---|---|---|---|
| "Top 15" | Sector | 2017 | 2018 | 2019 | 2020 | 2021 | 2007 to 2021 total sector jobs (announced) |
15-yr sector cumulative proportion |
Sector 5-yr trend (beta) |
Sector 15-yr trend (beta) |
2020-2021 average |
2-yr / 5-yr average |
2-yr / 15-yr average |
| 1 | Automotive components | 3,109 | 809 | 301 | 2,698 | 317 | 27,191 | 12% | 92.1 | -99.9 | 1,508 | 1.04 | 0.83 |
| 2 | Consumer products | 675 | 53 | 1,138 | 3,342 | 4,386 | 23,033 | 23% | 1,520.3 | 155.2 | 3,864 | 2.01 | 2.52 |
| 3 | Automotive OEM | 876 | 465 | 154 | 887 | 1,604 | 19,936 | 32% | 415.0 | -43.3 | 1,246 | 1.56 | 0.94 |
| 4 | Financial services | 1,283 | 2,041 | 239 | 308 | 181 | 13,874 | 39% | -551.1 | -9.0 | 245 | 0.30 | 0.26 |
| 5 | Software and IT services | 2,241 | 1,920 | 837 | 572 | 1,007 | 13,708 | 45% | -300.4 | 66.6 | 790 | 0.60 | 0.86 |
| 6 | Business services | 612 | 1,284 | 568 | 581 | 264 | 13,180 | 51% | -304.7 | -58.2 | 423 | 0.64 | 0.48 |
| 7 | Food and beverages | 306 | 1,228 | 892 | 1,231 | 548 | 12,821 | 57% | -170.1 | 9.7 | 890 | 1.06 | 1.04 |
| 8 | Transportation and warehousing | 1,502 | 625 | 1,022 | 560 | 1,242 | 11,410 | 62% | 138.9 | 18.1 | 901 | 0.91 | 1.18 |
| 9 | Industrial equipment | 304 | 1,691 | 209 | 573 | 43 | 8,750 | 66% | -458.0 | -12.5 | 308 | 0.55 | 0.53 |
| 10 | Metals | 149 | 472 | 340 | 269 | 382 | 8,552 | 70% | -34.1 | -17.9 | 326 | 1.01 | 0.57 |
| 11 | Plastics | 396 | 516 | 437 | 334 | 799 | 8,289 | 74% | 74.6 | -7.0 | 567 | 1.14 | 1.03 |
| 12 | Health care | 72 | 288 | 1,124 | 36 | 144 | 7,674 | 77% | -152.0 | -48.0 | 90 | 0.27 | 0.18 |
| 13 | Communications | 151 | 100 | 151 | 2,074 | 1,106 | 6,832 | 80% | 494.1 | 37.6 | 1,590 | 2.22 | 3.49 |
| 18 | Pharmaceuticals | 253 | 111 | 191 | 267 | 0 | 3,156 | 82% | 78.0 | -31.2 | 267 | 1.30 | 0.93 |
| 19 | Medical devices | 96 | 102 | 489 | 174 | 0 | 3,049 | 83% | 36.0 | -9.8 | 174 | 0.81 | 0.80 |
| Grand total—all sectors | 13,849 | 13,265 | 10,639 | 16,952 | 13,986 | 217,740 | 100% | 396.1 | -106.6 | 15,469 | 1.13 | 1.07 |
Note: This table is sorted by 15-year total sector jobs (Column 8).
Source: fDiMarkets
For those who are more visually oriented (and would have been plenty happy doing without Table 1), we provide three graphs to show the fifteen-year trends. The remaining figures present the “Top 15” in increments of five sectors.
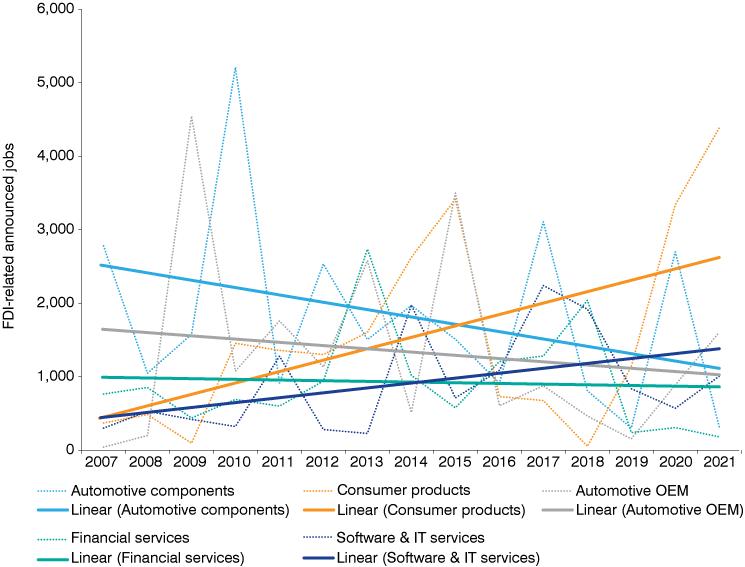
Figure 2 shows the top five industry sectors based on 15-year total announced FDI jobs by sector, with the solid lines as trends and the dotted, saw-toothed lines as the annual values. Automotive components, automotive OEM and financial services have been on a long downward trend, while software/IT services and consumer products—the latter predominantly Amazon—have been climbing.
Figure 2: Top 5 industry sectors, FDI announced jobs

Source: fDiMarkets
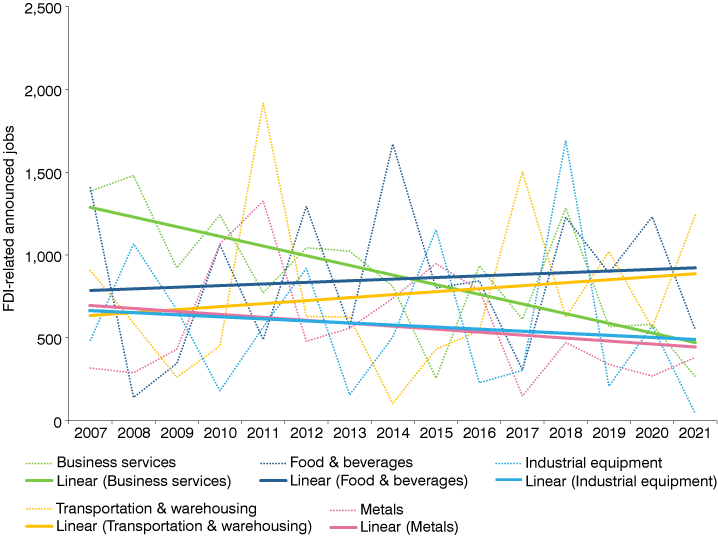
Figure 3 shows industry sectors ranked 6th through 10th based on 15-year total announced FDI jobs by sector, with the solid lines as trends and the dotted, shark-toothed lines as the annual values. Business services, metals and industrial equipment have been on an almost imperceptible decline, with business services being the least imperceptible. On the other hand, food and beverages, as well as transportation and warehousing, have shown an increase, albeit an almost mirror image of metals and industrial equipment.
Figure 3: Industry sectors ranked 6th to 10th, FDI announced jobs

Source: fDiMarkets
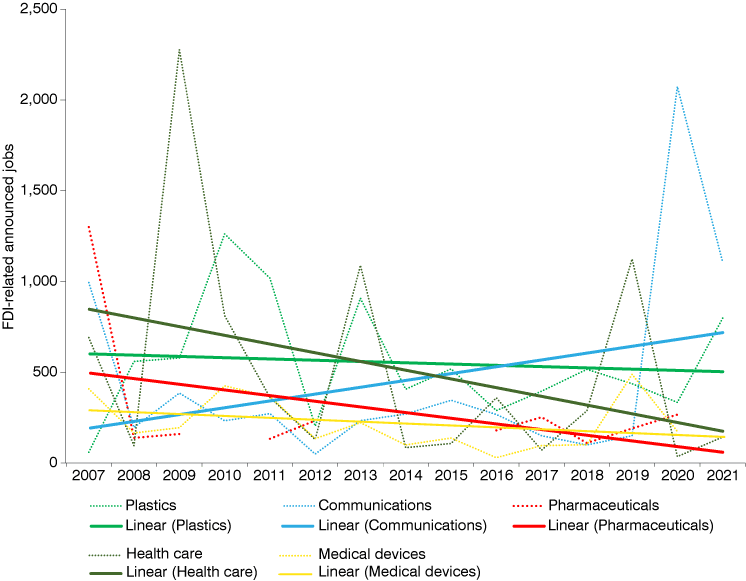
Figure 4 shows industry sectors ranked 11th through 15th based on 15-year total announced FDI jobs by sector, with the solid lines as trends and the dotted, jagged (and in some cases missing) teeth as the annual values. Other than communications, FDI job announcements have not trended up for this group. While plastics, pharmaceuticals and medical devices show an ascent over the last five years, their 15-year trend is negative.
That said, it is probably unfair that pharmaceuticals is considered on a downward trend given the exceptionally high value in 2007—there is no place to go when you are on the top—and together with the subsequent on-again, off-again FDI announcement experience through the years for the sector. Please keep two factors in mind: one, these are announced job and investment dollars that may or may not come to fruition and fDiMarkets does not track whether the investment announcements have come into being in microscopic detail. Two, if one were to remove the 2007 value and 2021 zero from the slope/beta calculation for pharma, the trend line would have a positive slope, that is, a plus 5.4. Not an Amazon/consumer-products slope or rate of change, but still positive.
Figure 4: Industry sectors ranked 11th to 15th, FDI announced jobs

Source: fDiMarkets
So why the obsession with suggesting a positive value for pharmaceuticals over time versus a negative value for the slope/trend as reported in Table 1? We need to be careful about how a presentation like this, especially one based not on solid-ground-truth data, may be misconstrued. We acknowledge that business leaders, government officials and consumers are anxious to get data and information about what is happening in the economy overall and the changing structure of the Indiana industries more specifically. We work with the imperfect data that we have access to, and the imperfect is better than nothing. The last thing we want is a significant pharmaceutical manufacturer in the state to misinterpret the analyses or take the IBRC to task for using incomplete or distorted data. We simply used the available data.
Our objective for this article was to see if the pandemic had a negative impact upon announced FDI investments and their attendant jobs, and thereby signal whether there will be lower levels of economic activity in the state resulting from diminished job-creating investment. Our tentative answer is: no.
Stay tuned to upcoming issues of InContext for further analysis of FDI within the state.
