The drivers of Indiana’s population growth since 2010

Despite fewer births, natural increase continues to be the primary driver of Indiana’s population growth.
The U.S. Census Bureau’s first data release from the 2020 census showed that Indiana’s population grew by 4.7% over the past decade to reach a total of nearly 6.8 million residents. The primary purpose of this release was to reapportion seats in the U.S. House of Representatives, and fortunately Indiana’s population growth was strong enough that the state retained its nine congressional seats.
While we are able to glean some interesting information from this initial release, Indiana’s total population count is still the only bit of local data available at this point. Additional releases beginning later this year will provide a detailed look at the characteristics of the state’s population down to the neighborhood level. In the meantime, we can at least combine Indiana’s total population count with data on births and deaths to estimate the components of the state’s population growth over the last 10 years.
Components of Indiana’s population growth
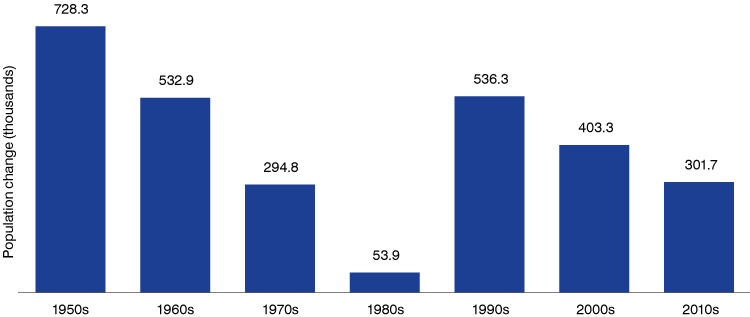
Indiana added roughly 302,000 residents over the past decade. As Figure 1 shows, this numeric change was roughly 25% lower than the state’s population growth between 2000 and 2010, and was the third-lowest gain over a decade since 1950.
Figure 1: Indiana population change by decade

Source: U.S. Census Bureau
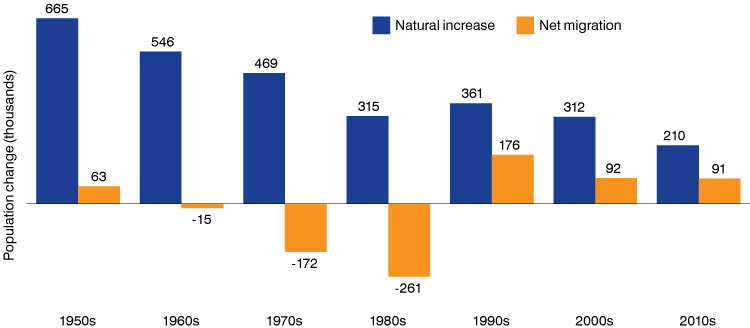
The size of a population changes in two ways: through natural increase (i.e., the number of births minus the number of deaths) and the net difference between in-migration and out-migration. Based largely on data from the Census Bureau’s annual population estimates program, the IBRC estimates that Indiana had a natural increase of roughly 210,000 residents between 2010 and 2020, which accounts for 70% of the state’s total growth over this period. In our estimates, Indiana’s remaining population growth of more than 91,000 residents over the decade is assumed to be a product of an overall net in-migration of residents.
As Figure 2 highlights, this is the third consecutive decade where Indiana can boast of a net inflow of residents, and it essentially matches the level of net in-migration to the state during the 2000s. Furthermore, this level of migration is well above expectations. Data from the Census Bureau’s latest population estimates had the state’s total net in-migration for the decade at 62,000 residents.
Figure 2: Total components of change by decade

Sources: IBRC, using data from the U.S. Census Bureau and the Applied Population Laboratory, University of Wisconsin–Madison (estimates for the 1950s through 2000s) and from the U.S. Census Bureau, Indiana State Department of Health and the U.S. Centers for Disease Control and Prevention (estimates for 2010s)
While migration is often the first thing that jumps to mind when thinking about population change, natural increase has long been the dominant source of growth in the state. In fact, Indiana had a three-decade run with a net outflow of residents between the 1960s and 1980s, yet the state continued to grow due to high levels of natural increase. As the population ages, however, this measure has steadily declined over the last 70 years.
Focusing on the 2010s, the level of natural increase over this period was down by roughly one-third relative to the previous decade. While some continued slippage in this measure was expected, the state’s drop in natural increase has accelerated in recent years due to both a dramatic decline in fertility rates and an increase in mortality that is not fully explained by an aging population.
In terms of births, fertility rates have been dropping since the beginning of the Great Recession,1 and have fallen to the point where provisional data from the Centers for Disease Control and Prevention (CDC) indicate that Indiana had only 78,100 births in 2020,2 which would be the state’s lowest annual total on record dating back to 1969. With respect to the increase in deaths, a startling rise in mortality rates among Indiana’s working-age population over the last two decades—driven largely by drug- and alcohol-induced causes—has resulted in an overall decline in life expectancy in the state since 2010.3
The geography of natural increase
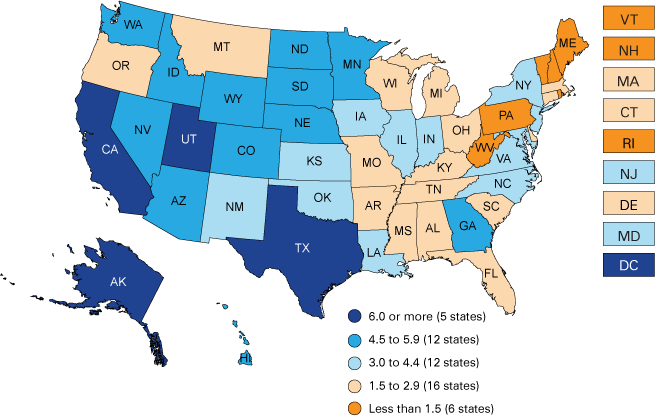
Compared to other states, Indiana’s rate of natural increase ranks in the middle of the pack. Between 2010 and 2019,4 Indiana had an average annual natural increase of 3.2 per 1,000 residents. This mark is slightly below the U.S. rate of 3.9, and ranks 28th-highest among states (see Figure 3). Looking at Indiana’s neighbors, only Illinois had a higher rate of natural increase over this period. West Virginia and Maine have actually had a natural decrease of their populations over the past decade, meaning that deaths outnumber births.
Figure 3: Average annual natural increase per 1,000 residents by state, 2010 to 2019

Source: U.S. Census Bureau
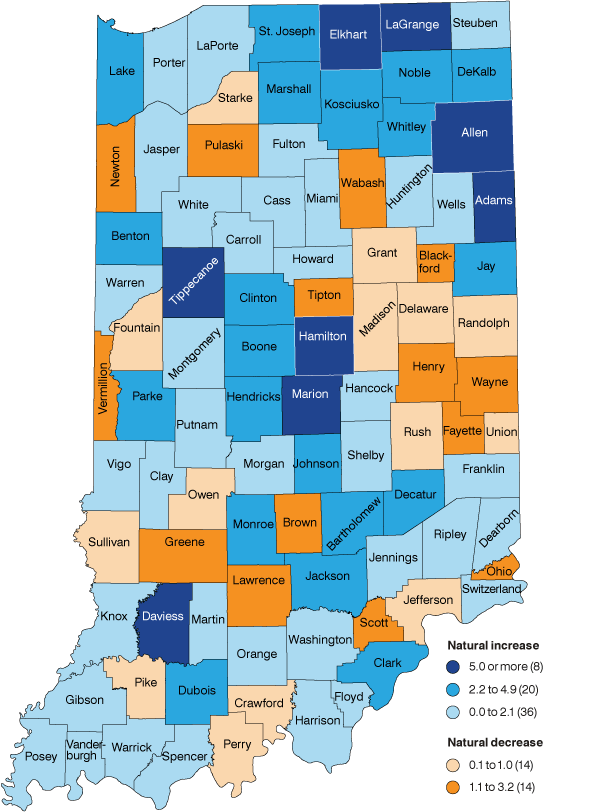
Within Indiana, the level of natural increase varies widely across counties. Due in large part to their sizable Amish populations, rural LaGrange and Adams counties lead the state in the rate of natural increase with marks above 10 per 1,000 residents for both (see Figure 4). In general, however, Indiana communities with high rates of natural increase tend to be concentrated in a handful of metropolitan areas. Only 16 of the state’s 92 counties have a rate of natural increase that is above the state average, and five of these are in the Indianapolis metro area. Other metro areas with relatively high rates of natural increase include Elkhart, Lafayette, Fort Wayne, Columbus and South Bend. Meanwhile, nearly one-third of Indiana counties had a natural decrease over this period, with Fayette, Vermillion and Wabash counties showing the largest decreases.
Figure 4: Average annual natural increase per 1,000 residents by county, 2010 to 2019

Source: U.S. Census Bureau
Conclusion
Even with stronger than expected net migration to Indiana over the past decade, natural increase continues to be the primary driver of population growth for the state. However, with an aging population, natural increase as a source of growth no longer packs the same punch, and its role will continue to be diminished over the next couple of decades at least. Shifts in fertility rates and mortality among the working-age population have only accelerated this decline in recent years. Looking ahead, Indiana’s population growth rates are bound to continue declining for a while, and our ability to retain current residents while also attracting new ones will play an ever-larger role in the state’s growth trends.
Notes
- Matt Kinghorn, “A decade of declining births,” InContext, May-June 2019, www.incontext.indiana.edu/2019/may-jun/article2.asp
- B.E. Hamilton, J. A. Martin and M. J. K. Osterman, “Births: Provisional data for 2020,” Vital Statistics Rapid Release; no 12, National Center for Health Statistics, May 2021, www.cdc.gov/nchs/data/vsrr/vsrr012-508.pdf
- Matt Kinghorn, “Indiana’s life expectancy falling further behind U.S.,” Indiana Business Review, Summer 2021, www.ibrc.indiana.edu/ibr/2021/summer/article1.html
- Geographic comparisons are limited to data from the 2010 to 2019 period so as not to include higher death estimates for 2020 due to the COVID-19 pandemic.
