Indiana sees stronger population growth in 2018

Indiana’s 2018 gains are strong by post–Great Recession standards, but this level of growth is still well below that seen during much of the 1990s and 2000s.
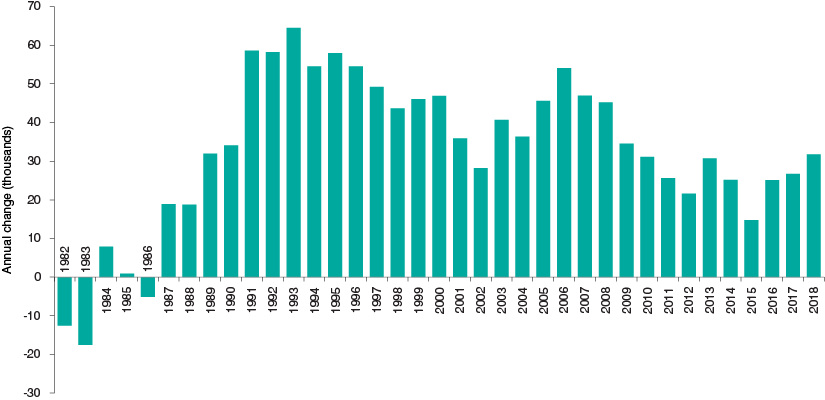
Indiana added nearly 31,800 residents in 2018 to reach a total population of 6.69 million, according to the latest population estimates from the U.S. Census Bureau. This 0.5 percent increase represents the state’s largest annual gain since 2009 and the rate of growth outpaced each of its neighboring states.
While Indiana’s 2018 gains are strong by post–Great Recession standards, this level of growth is still well below that seen during much of the 1990s and 2000s (see Figure 1). Indiana’s average annual population gain during the 1990s was 53,600 residents per year, for instance, while the state added an average 40,300 people annually during the 2000s.
Figure 1: Indiana annual population change
Source: U.S. Census Bureau
This article will examine the demographic drivers of this recent uptick in population growth, as well as present population trends around the state.
Around Indiana
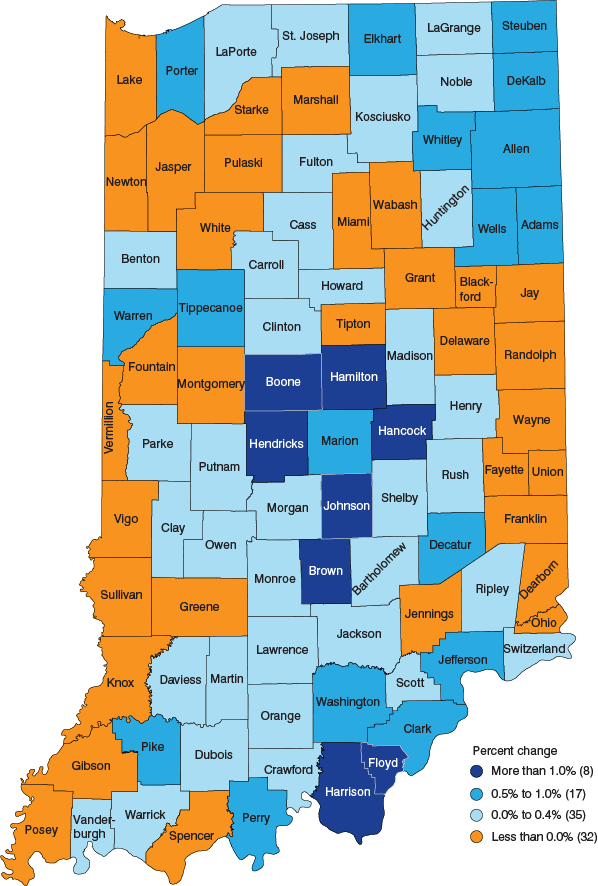
In 2018, 60 of Indiana’s 92 counties posted a population gain—the largest such tally so far this decade (49 counties in 2014 was the previous high). As usual, the state’s fastest-growing counties are in the Indianapolis metro area (see Figure 2). Hamilton County led the way with a 2.2 percent increase, followed by Hendricks County (2.0 percent), Hancock County (1.9 percent) and Boone County (1.8 percent). After averaging a decline of 30 residents per year between 2010 and 2017, Brown County’s population grew by an estimated 235 people in 2018—good for the state’s fifth-highest rate of growth at 1.6 percent.
Figure 2: Percent change in population by county, 2017 to 2018
Source: U.S. Census Bureau
In terms of the largest numeric gains, Hamilton County again leads the way for the fourth straight year with a gain of 7,004 residents. Marion County posted the state’s second-largest increase, adding 5,718 residents in 2018. Other top gainers include Hendricks (3,251), Allen (3,141) and Johnson (2,303) counties.
Even with this slight rebound in population growth statewide, more than one-third of Indiana counties still lost population last year. Delaware County had the largest decline with an estimated loss of 617 residents. Lake County had the state’s second-largest drop at 355 residents. For Lake County, this 0.1 percent decline actually represents a significant improvement, as the county averaged a decline of roughly 1,600 residents per year between 2010 and 2017. As for the pace of decline, Union County had the state’s fastest rate of decline last year at 1.7 percent, followed by Blackford (-0.8 percent), Miami (-0.7 percent), and Jay (-0.7 percent) counties.
Indiana’s metropolitan areas
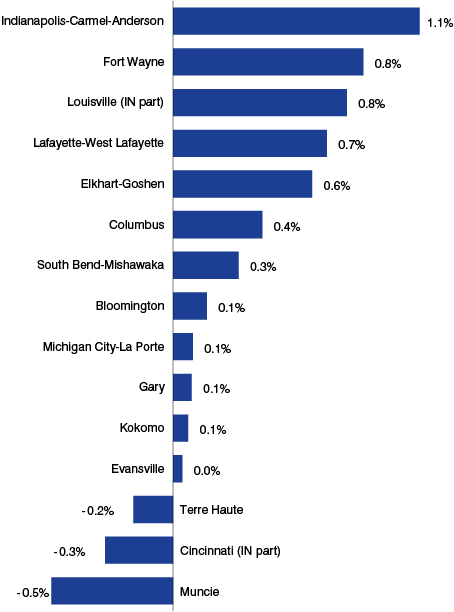
Population growth in Indiana continues to be driven by a handful of metropolitan areas. Chief among these is the 11-county Indianapolis-Carmel-Anderson metro area, which added nearly 22,000 residents last year, accounting for 69 percent of Indiana’s net growth in 2018. The Indy metro area is home to 2.04 million people, which represents 31 percent of the state’s population and ranks as the nation’s 34th-largest metro area (out of 383 metros).
Compared to large metro peers in neighboring states, the Indy area’s growth rate of 1.1 percent in 2018 was lower than Columbus, Ohio (1.2 percent), but it outpaced Cincinnati (0.5 percent), Louisville (0.3 percent), Detroit (0.1 percent), Cleveland (-0.1 percent) and Chicago (-0.2 percent).
The Gary Division of the Chicago metro (Lake, Porter, Jasper and Newton counties) is the state’s second-largest area with 701,386 residents. The Gary area added 576 residents last year, which marks only the second time since 2010 that this area posted a population gain.
As Figure 3 shows, most of Indiana’s other metro areas also grew last year, including Fort Wayne (0.8 percent growth), the Indiana portion of the Louisville area (0.8 percent), Lafayette-West Lafayette (0.7 percent) and Elkhart-Goshen (0.6 percent).
Figure 3: Population growth rates for Indiana metro areas, 2017 to 2018
Source: U.S. Census Bureau
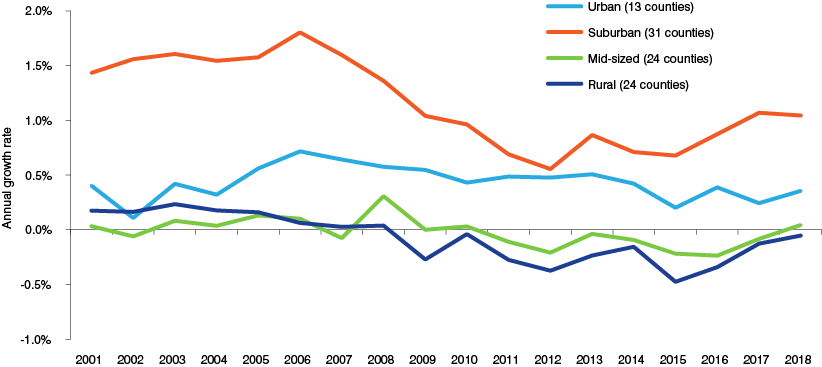
Figure 4 helps to further illustrate the degree to which metro areas are responsible for Indiana’s population growth. The state’s suburban counties are still not growing at the rate seen prior to the Great Recession, but this collection of counties has seen an uptick in growth in recent years and combined to account for 62 percent of the state’s gains in 2018. Meanwhile, many of Indiana’s 48 mid-sized counties1 and rural counties have also seen some improvement recently, but as a group, population growth for these county types was essentially flat in 2018.
Figure 4: Annual population growth by county type
Source: U.S. Census Bureau
Causes of slower growth
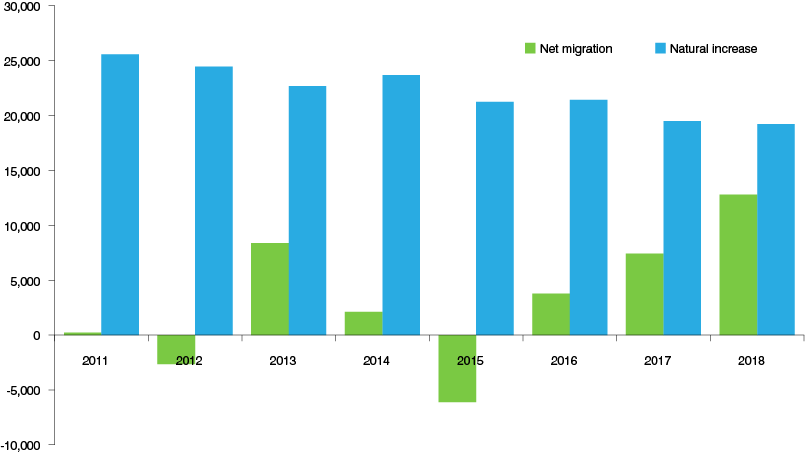
The recent upswing in the state’s population growth has been driven entirely by increasing net migration. Between 2010 and 2017, Indiana had an average annual net inflow of roughly 1,900 residents, yet this measure stood at nearly 12,800 residents in 2018. Not only does this number stand out in this largely low-migration period after the Great Recession, it is also significantly higher than the state’s average annual net inflow of 9,200 residents per year in the 2000s, although it is still well below the mark of 17,600 residents per year during the 1990s.2
On the other hand, natural increase (i.e., births minus deaths)—while still the largest component of change for the state—continues to act as a headwind for the state’s population growth trend (see Figure 5). Indiana’s slide in natural increase is the result of a slow but steady rise in the number of deaths as the state’s population ages coupled with a dramatic decline in the number of births in Indiana over the last 10 years. In fact, the Census Bureau estimates that there were a total of 81,075 births in the state in 2018, which is the lowest annual total in Indiana since 1987. (Read "A decade of declining births," also in this issue, for more on this topic.)
Figure 5: Indiana's components of population change
Source: U.S. Census Bureau
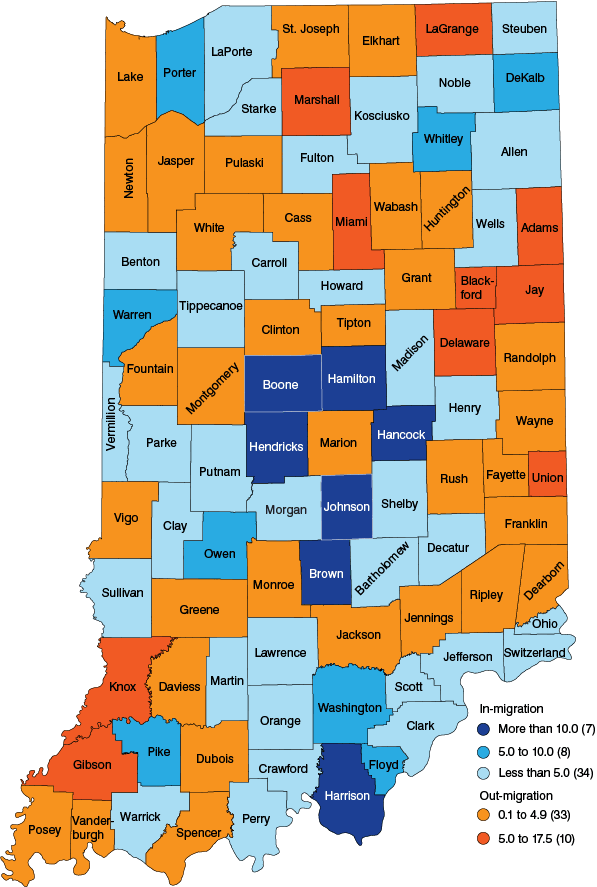
Around the state, 49 Indiana counties had net in-migration of residents in 2018 (see Figure 6). In terms of the rate of inflow, Brown County led the way with a net inflow of roughly 18 movers per 1,000 residents in 2018.
Figure 6: Net migration per 1,000 residents, 2018
Source: U.S. Census Bureau
As for natural increase, 26 Indiana counties actually registered a natural decrease of the population in 2018, meaning that there were more deaths in the county than births over the course of the year.
Conclusion
This examination of the components of population change shows how difficult it will be for Indiana to return to levels of population growth seen during previous decades. Fertility rates in Indiana, and throughout the nation as a whole, have been declining for a decade. While there could be room for some modest rebound in this area, it is difficult to imagine a significant shift in this trend in the near term. Add in the fact that the number of deaths will continue to climb as the state’s population ages, and natural increase will contribute less and less to Indiana’s population growth over the next couple of decades.
So even when the state posts a very strong net in-migration of nearly 12,800 residents last year, Indiana’s total population gain pales in comparison to the levels seen during the 1990s and 2000s. Therefore, we may have to adjust our thinking on what constitutes healthy population growth. Looking ahead, however, one thing that is certain is that the strength of Indiana’s population growth trend will increasingly hinge on its ability to attract new residents.
Notes
- Mid-sized counties refers to federally designated Micropolitan Statistical Areas, which are defined as counties with a city or town that has a population between 10,000 and 50,000 residents.
- Richelle Winkler, Kenneth M. Johnson, Cheng Cheng, Jim Beaudoin, Paul R. Voss and Katherine J. Curtis, “Age-Specific Net Migration Estimates for U.S. Counties, 1950-2010,” Applied Population Laboratory, University of Wisconsin–Madison, 2013, www.netmigration.wisc.edu/.
