2018 voter turnout: Was it as impressive as it seemed?

The 2018 midterm election had the highest voter turnout for a midterm election in over a century.
For the latter half of 2018, it was nearly impossible to avoid discussion of November’s midterm election. With countless political ads and pundits stressing the importance of the election for both sides of the aisle, there seemed to be a sense of increased political awareness and perhaps participation, particularly for a non-presidential election.
But did this “sense” translate to a greater number of voters at the polls? The answer, in short, is a resounding yes.
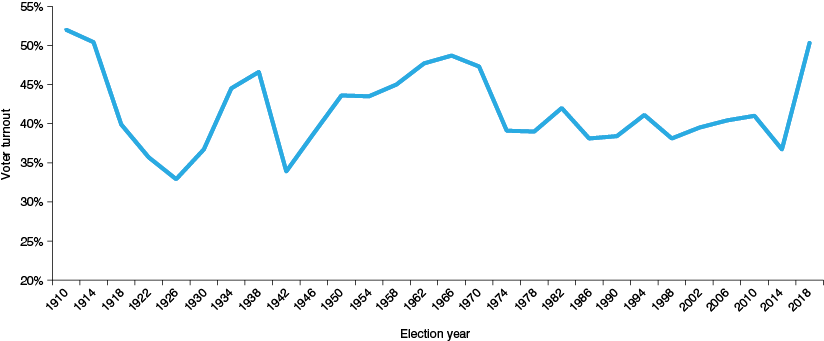
In fact, the 2018 midterm election had the highest voter turnout for a midterm election in over a century. According to the United States Elections Project, 50.3 percent of registered voters in the United States cast their ballot in 2018, the highest turnout rate for a midterm election since 1914 (50.4 percent). To put those numbers into perspective, the 2010 midterm election saw a voter turnout rate of 41 percent, while only 36.7 percent of those registered cast votes in 2014 (see Figure 1).1, 2
Figure 1: Voter turnout for midterm elections in the United States

Source: United States Elections Project
Astoundingly, the 2018 midterm national turnout rate even came close to matching voter turnout for the 1996 presidential election, which only saw 51.7 percent of registered voters at the polls.
Although this was clearly a victory for democracy at the national level, did this healthy uptick in voter turnout also occur in the Hoosier state? Again, the answer is yes.
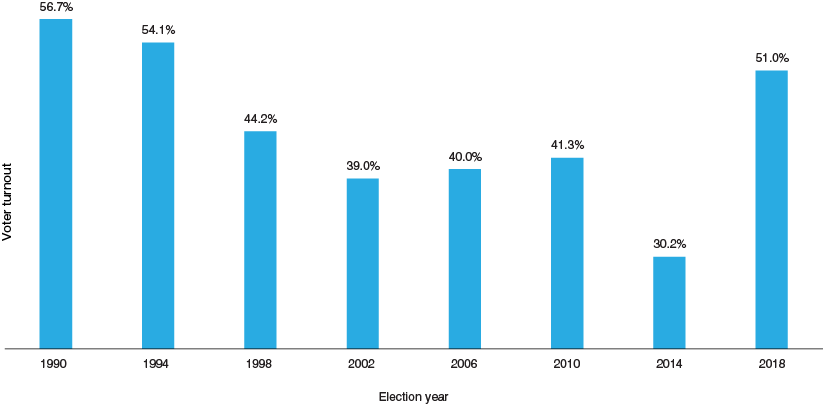
Indiana’s 2018 voter turnout just barely surpassed the national turnout rate, with 51 percent of registered voters casting more than 2.3 million ballots. Like the national figures, this was a significant upswing in voter turnout from the 2010 and 2014 midterm elections, which drew 41.3 percent (over 1.7 million ballots) and 30.2 percent (nearly 1.4 million ballots) of registered voters, respectively.3
The 2018 Indiana turnout rate was the highest it has been for a midterm election since 1994, which saw a voter turnout rate of 54.1 percent (see Figure 2).
Figure 2: Voter turnout for midterm elections in Indiana

Source: IN.gov Indiana Election Division, Voter Registration and Turnout Statistics
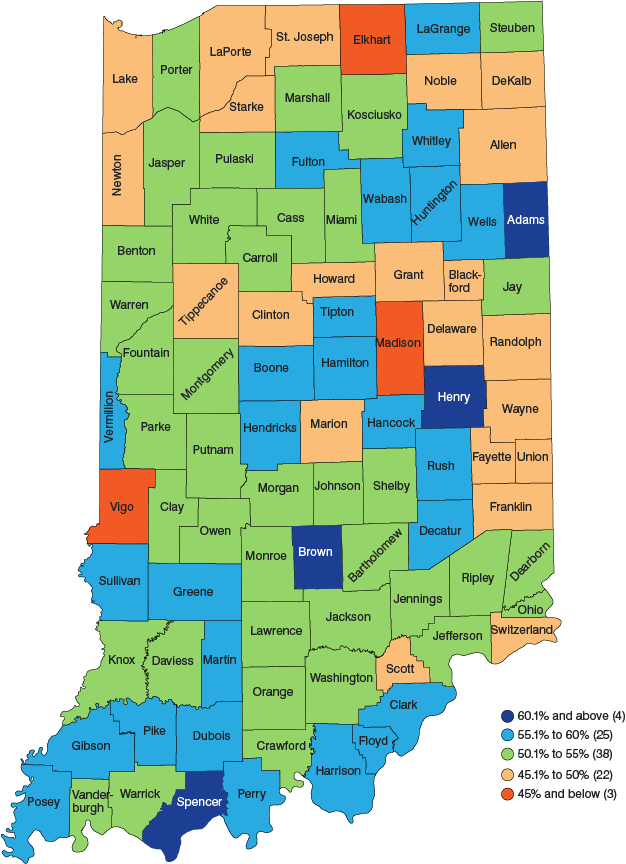
The county with the highest voter turnout in 2018 was Henry County, with an impressive 63.8 percent of registered voters exercising their right to vote. Henry County’s high turnout rate was followed by Spencer (61.5 percent), Brown (61.4 percent), Adams (60.4 percent) and Wells (60 percent) counties. Marion County, the most populous county in the state, had 47.8 percent of those registered cast votes, which ranks it 80th out of 92 counties for voter turnout.
The counties with the lowest voter turnout in the state were Vigo (44.2 percent), Madison (44.2 percent), Elkhart (45.0 percent), Switzerland (45.7 percent) and Newton (46 percent), as shown in Figure 3.
Figure 3: Indiana county voter turnout rates for the 2018 midterm election

Source: IN.gov Indiana Election Division, Voter Registration and Turnout Statistics
Except for Jay County, all Indiana counties experienced a double-digit percent change in voter turnout in 2018 as compared to the 2014 midterm election. Five counties (Hamilton, Johnson, Monroe, Miami and Hancock) more than doubled their 2014 voter turnout rates, and 50 counties experienced a percent change in voter turnout of 50 percent or higher. The average percent change in turnout for counties between 2018 and 2014 was 55.1 percent.
Table 1 lists the Indiana counties with the highest and lowest percent change in voter turnout between the 2018 and 2014 midterm elections. It is important to note that these percent changes are not indicative of a high or low turnout necessarily—they just highlight the change between the two most recent midterm elections.
Table 1: Top 10 Indiana counties with highest and lowest percent changes in voter turnout between 2018 and 2014 midterm elections
| Highest percent change | |||
|---|---|---|---|
| 2018 | 2014 | Percent change | |
| Hamilton | 58.4% | 27.5% | 112% |
| Johnson | 50.2% | 23.9% | 110% |
| Monroe | 53.8% | 25.8% | 109% |
| Miami | 52.0% | 25.3% | 105% |
| Hancock | 55.4% | 27.5% | 101% |
| Vanderburgh | 51.1% | 26.0% | 96% |
| Wabash | 55.9% | 28.9% | 94% |
| Dearborn | 54.3% | 28.1% | 93% |
| Marion | 47.8% | 24.7% | 93% |
| DeKalb | 49.5% | 25.9% | 92% |
| Lowest percent change | |||
| 2018 | 2014 | Percent change | |
| Knox | 52.9% | 41.6% | 27% |
| Crawford | 52.8% | 41.6% | 27% |
| Greene | 57.9% | 46.0% | 26% |
| Perry | 59.4% | 47.9% | 24% |
| Pike | 58.9% | 47.9% | 23% |
| Union | 48.5% | 40.2% | 20% |
| Martin | 59.4% | 49.4% | 20% |
| Jennings | 51.9% | 43.3% | 20% |
| Ohio | 52.8% | 48.0% | 10% |
| Jay | 53.3% | 52.1% | 2% |
Source: IN.gov Indiana Election Division, Voter Registration and Turnout Statistics
It is interesting to note that Jay County, the county with the lowest percent change in voter turnout between 2018 and 2014, had the highest voter turnout rate in 2014, with 52.1 percent of registered voters casting their ballots. Since Jay County already had high voter participation, it experienced less change in voter turnout in 2018.
Another noteworthy thing worth mentioning is that Indiana cleaned up its voter rolls between the 2014 and 2018 midterm elections. A large number of outdated records on the voter rolls artificially lowers the turnout percentages. During this process, postcards were used to verify home addresses and confirm that voter lists were updated. This process resulted in the removal of nearly 500,000 registered voters from voter rolls.4 Due to this update, there were fewer registered voters in 2018 than in 2014.
For democracy to operate properly, voter participation is an absolute necessity. With turnout numbers this strong in a midterm election, Hoosiers should feel reassured about the level of political consciousness and participation in their state, particularly as we approach the 2020 election.
Notes
- Michael P. McDonald, “National General Election VEP Turnout Rates, 1789-Present,” United States Elections Project, January 14, 2019, www.electproject.org/national-1789-present.
- Census Bureau voting statistics for the 2018 midterm election have not been released yet. The latest voting and registration data available is 2016.
- IN.gov – Indiana Election Division, “Voter Registration and Turnout Statistics,” IN.gov, January 14, 2019, www.in.gov/sos/elections/2983.htm.
- Max Greenwood, “Indiana Purges Nearly 500,000 from Voter Rolls,” The Hill, April 20, 2017, https://thehill.com/blogs/ballot-box/329659-indiana-purges-nearly-half-a-million-from-voter-rolls.
