Job concentration and the challenge of rural development in Indiana

The data since 2000 paints a very uneven distribution of job growth across Indiana's metro areas.
Indiana has experienced a surge of employment since the Great Recession ended in 2009. This has spurred much discussion on the relative size of these job gains and those taking credit or laying blame for the numbers. While the size and speed of job growth is a worthy subject deserving such debate, we wanted to look at the distribution of job growth and its implications on rural development.
The analysis uses U.S. Bureau of Labor Statistics (BLS) metropolitan statistical area (MSA) data—specifically, Current Employment Statistics (CES) seasonally adjusted employment data from 2000 through 2018 (the final year of complete data). We calculated average annual employment data for each MSA.
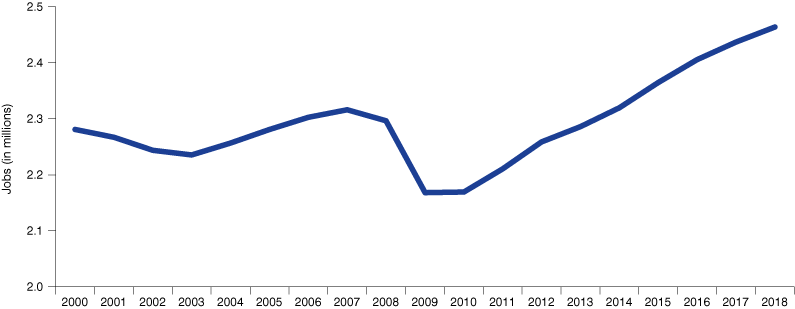
Figure 1 shows MSA employment growth from the depth of the Great Recession. In total, the employment picture in 2018 shows steady growth after 2009 and gains from 2000. Again, the strength of this recovery is a worthy consideration, but not the focus of this analysis. Overall, this graphic presents a picture of recovery for the state.
Figure 1: Indiana employment for all MSAs
Note: These data exclude the Indiana portion of both the Louisville and Cincinnati metros, but include the out-of-state portions of the Evansville and South Bend-Mishawaka metros.
Source: U.S. Bureau of Labor Statistics
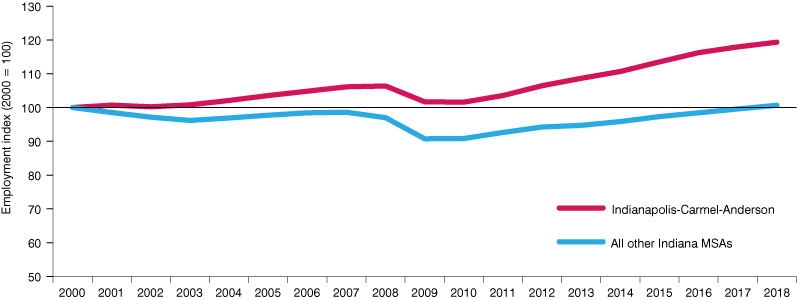
However, when the Indianapolis-Carmel-Anderson MSA is separated out, one sees an unequal distribution of these employment gains (see Figure 2).
Figure 2: Indiana MSA employment index since 2000
Note: These data exclude the Indiana portion of both the Louisville and Cincinnati metros, but include the out-of-state portions of the Evansville and South Bend-Mishawaka metros.
Source: U.S. Bureau of Labor Statistics
The Indianapolis-Carmel-Anderson MSA experienced a more modest decline during the Great Recession and, at its depths, never fell below the employment level of 2000. Since 2009, the MSA has added employment at an average annual rate of 1.8 percent.
Combined, all other MSAs in Indiana fell below the year 2000’s employment levels long before the Great Recession even started and then took an even more substantial hit. The gains since 2009 have struggled to regain the lost ground. Only in 2018 did the employment level in all other Indiana MSAs finally surpass 2000’s employment level. While the employment gains since 2009 have been steady, the average annual employment growth rate has been more modest at 1.2 percent.
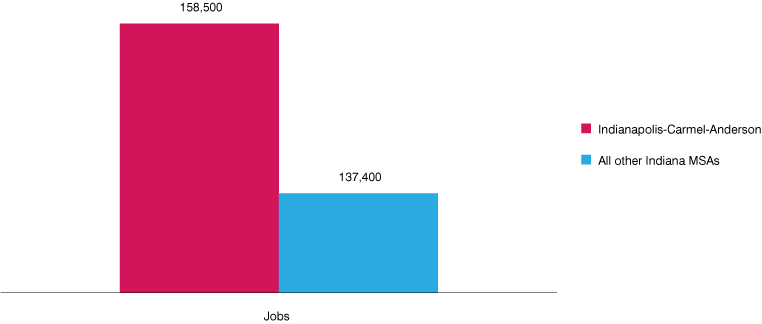
Since 2009, over 54 percent of MSA job growth in Indiana was localized to the Indianapolis-Carmel-Anderson MSA (see Figure 3).
Figure 3: Job growth, 2009 to 2018
Note: These data exclude the Indiana portion of both the Louisville and Cincinnati metros, but include the out-of-state portions of the Evansville and South Bend-Mishawaka metros.
Source: U.S. Bureau of Labor Statistics
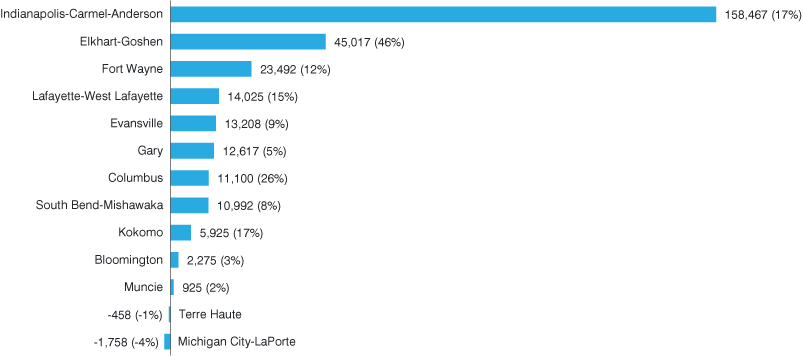
Figure 4 shows the distribution of these employment gains for the individual MSAs since 2009. While the Indianapolis region clearly dominated in numeric terms, it should be noted that both the Elkhart-Goshen and Columbus MSAs had substantially higher rates of employment growth relative to the Indianapolis-Carmel-Anderson metro in percentage terms.
Figure 4: Change in employment by Indiana MSA, 2009 to 2018
Note: These data exclude the Indiana portion of both the Louisville and Cincinnati metros, but include the out-of-state portions of the Evansville and South Bend-Mishawaka metros.
Source: U.S. Bureau of Labor Statistics
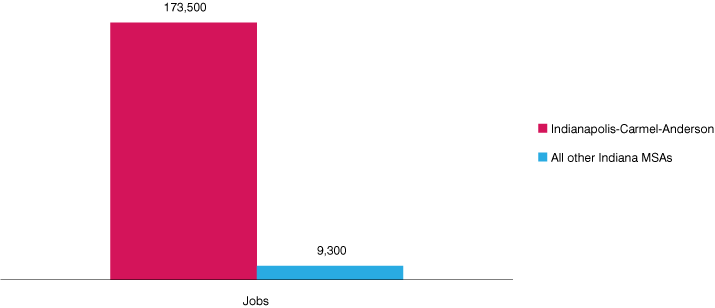
The picture is even starker with a longer time series. Since 2000, about 95 percent of MSA job growth in Indiana has been localized to the Indianapolis-Carmel-Anderson MSA (see Figure 5).
Figure 5: Job growth, 2000 to 2018
Note: These data exclude the Indiana portion of both the Louisville and Cincinnati metros, but include the out-of-state portions of the Evansville and South Bend-Mishawaka metros.
Source: U.S. Bureau of Labor Statistics
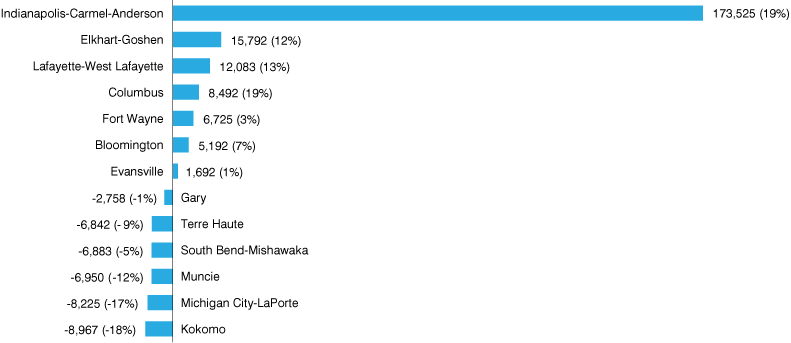
The distribution of these employment gains since 2000 at the MSA level are shown in Figure 6. Six MSAs have experienced employment declines relative to 2000, and only Columbus has matched the Indianapolis region in terms of percent growth.
Figure 6: Change in employment by Indiana MSA, 2000 to 2018
Note: These data exclude the Indiana portion of both the Louisville and Cincinnati metros, but include the out-of-state portions of the Evansville and South Bend-Mishawaka metros.
Source: U.S. Bureau of Labor Statistics
Summary
The data since 2000 paints a very uneven distribution of job growth. Jobs in the Indianapolis-Carmel-Anderson MSA increased by 19 percent, while all other Indiana MSAs combined for 1 percent growth. The employment growth numbers from 2009 are slightly more even. However, even since 2009, job creation in the Indianapolis-Carmel-Anderson MSA was 17 percent compared to 11 percent for all other metros combined.
These data suggest that job creation is increasingly concentrated. In an increasingly knowledge- and information-based economy, the positive externalities of clustering human and physical capital produces economic growth and employment opportunities. However, this leaves economic growth and employment growth a challenge for rural, low skill and/or low population density areas. Standard responses and initiatives have proved ineffective in altering the growing concentration, and new approaches must be sought out for implementation.
