Many Indiana counties see stronger population growth in 2017

Indiana’s improved population growth was driven by a significant uptick in migration to the state.
Fifty-five of the state’s 92 counties had a population increase last year—the largest number of Indiana counties to post a gain since 2008, according to the 2017 population estimates released by the U.S. Census Bureau.
Even among the communities that continue to lose population, many saw less of a decline in 2017 than they had in recent years. All told, nearly three out of every four Indiana counties had a level of population change in 2017 that was an improvement over their average annual change from 2010 to 2016.
Statewide, Indiana added 32,800 residents in 2017—a 0.5 percent increase. This was the state’s largest annual population gain since 2009, and ranked it as the 25th fastest-growing state in 2017.
Indiana’s improved population growth was driven by a significant uptick in migration to the state. After averaging a net in-migration of just 940 residents per year over the previous six years, Indiana had a net inflow of more than 10,400 residents in 2017.
While migration is up, the state’s birth rate, which began to decline after the Great Recession, remains low. As a result, Indiana’s natural population increase, which is a measure of the difference between the number of births and the number of deaths, was nearly 30 percent lower last year than the typical mark set between 2000 and 2010.
Diving into population change around the state
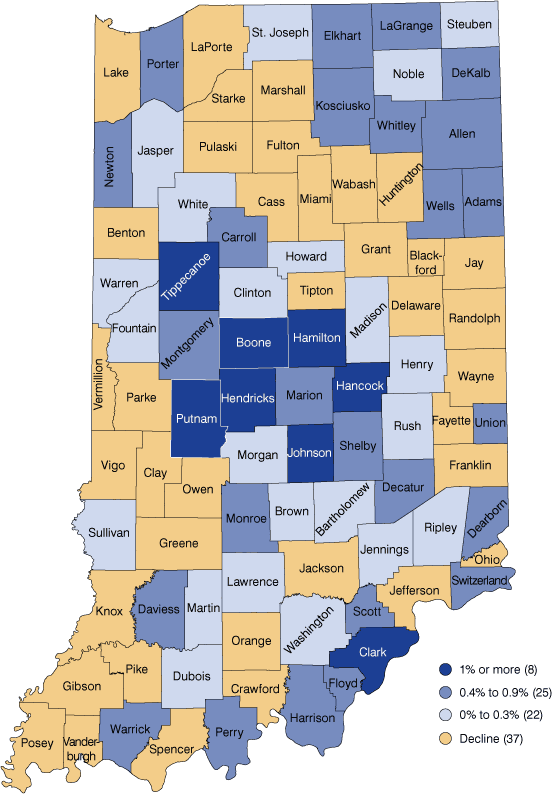
Indiana’s six fastest-growing counties were all in the Indianapolis metro area (see Figure 1). Boone County led the way with a 2.5 percent increase in 2017, followed by Hamilton (2.4 percent), Hendricks (2.1 percent), Hancock (1.6 percent), Johnson (1.6 percent) and Putnam (1.2 percent) counties.
Figure 1: Percent change in population, 2016 to 2017

Source: IBRC, using U.S. Census Bureau population estimates
Tippecanoe County was the fastest-growing county outside the Indianapolis metro area with a 1.0 percent rate of growth in 2017. The rest of the state’s top 10 counties were Clark (1.0 percent increase), Monroe (0.9 percent) and Whitley (0.8 percent).
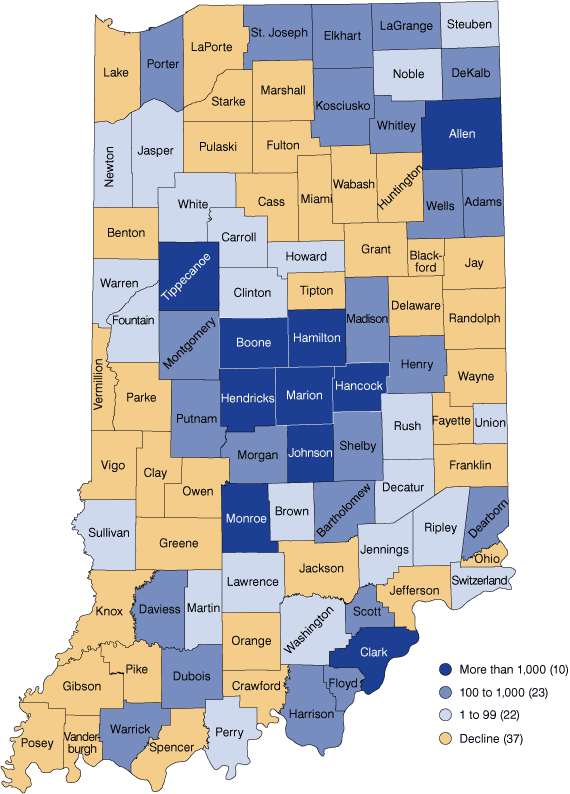
In terms of numeric change, Hamilton County posted the state’s largest increase, adding 7,451 residents in 2017 (see Figure 2). Marion County was second, with a pick-up of 6,048 residents. Other top gainers include Hendricks (3,349), Allen (2,905) and Johnson (2,354) counties.
Figure 2: Numeric change in population, 2016 to 2017

Source: IBRC, using U.S. Census Bureau population estimates
Of the 37 Indiana counties that lost population in 2017, Ohio County had the greatest pace of decline at -1.0 percent. Blackford (-0.8 percent), Vermillion (-0.7 percent), Miami (-0.6 percent) and Pulaski (-0.6) counties also posted significant losses in population last year. Lake County had the state’s largest numeric decline with an estimated loss of 952 residents in 2017.
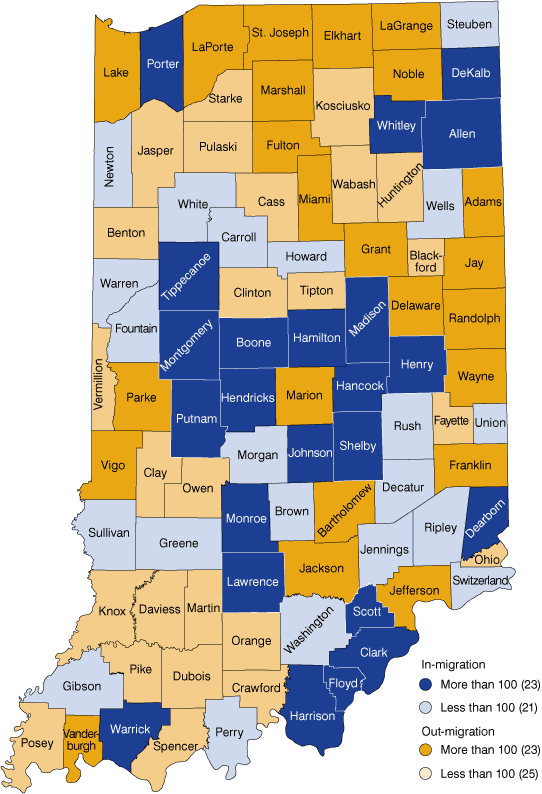
For counties losing population last year, a net out-migration of residents was the primary driver of decline (see Figure 3). In Indiana, 48 counties had more people move away last year than move in. Lake County led this trend with an estimated net outflow of 1,854 movers in 2017, while Elkhart (-636), Vanderburgh (-455), LaGrange (-331) and Marion (-324) counties had the next-largest net out-migrations.
Figure 3: Net migration, 2016 to 2017

Source: IBRC, using U.S. Census Bureau population estimates
At the other end of the spectrum, Hamilton (5,285), Hendricks (2,626), Johnson (1,731), Boone (1,304) and Hancock (965) counties in the Indianapolis metro area had the largest net in-migration of residents in 2017. Other communities with strong net inflows of residents include Porter (889), Clark (852), Monroe (837), Allen (754) and Tippecanoe (646) counties.
Indiana’s largest counties and metropolitan areas
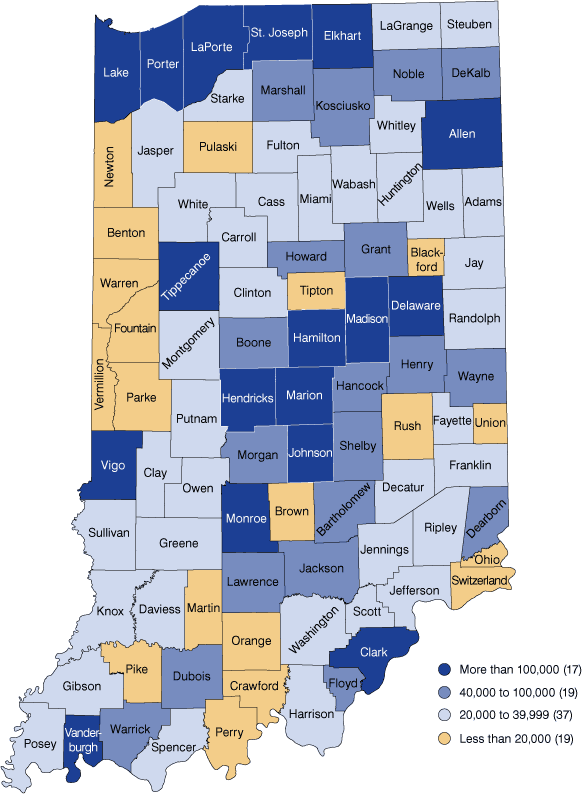
Indiana has six counties with populations greater than 200,000 (see Figure 4). Marion County is the state’s largest with 950,082 residents, ranking it as the nation’s 52nd most populous county in 2017 (out of 3,142 counties). Other large counties in the state include Lake (485,640), Allen (372,877), Hamilton (323,747), St. Joseph (270,434) and Elkhart (205,032).
Figure 4: Total population, July 2017

Source: IBRC, using U.S. Census Bureau population estimates
The 11-county Indianapolis-Carmel-Anderson metro area continues to drive population growth in the state, with an increase of roughly 23,000 residents last year. The Indy metro area accounts for 30 percent of the state’s total population and ranks as the nation’s 34th-largest metro area (out of 382 metros).
Compared to large metro-area peers in neighboring states, the Indy area’s growth rate of 1.1 percent in 2017 was lower than Columbus, Ohio (1.6 percent), but it outpaced Louisville (0.7 percent), Cincinnati (0.6 percent), Detroit (0.2 percent), Cleveland (-0.1 percent) and Chicago (-0.1 percent).
The three-county Fort Wayne area is the state’s second-largest metro area with 434,617 residents. The Fort Wayne metro area posted a 0.8 percent increase in 2017 and ranked as the 125th-largest metro area in the nation. Most of Indiana’s other large metro areas also grew last year, including South Bend-Mishawaka (0.3 percent), Lafayette-West Lafayette (0.9 percent) and Elkhart-Goshen (0.4 percent). The so-called Gary Division of the Chicago metro, which consists of four counties in Northwest Indiana, added 153 residents in 2017.
In all, 44 of Indiana’s 92 counties belong to a metropolitan area. These counties combined account for 78 percent of Indiana’s total population, and as a group grew at a 0.6 percent rate in 2017. The state’s 48 counties that are not part of a metro area had a combined population loss of 493 residents last year.
Learn more
To access all of the data for Indiana and beyond, visit the Population topic page at STATS Indiana.
