How Indiana's manufacturing employment is changing
Indiana's manufacturing sector employs fewer people than it did 15 years ago, but remains the largest private industry component of the state's gross domestic product.
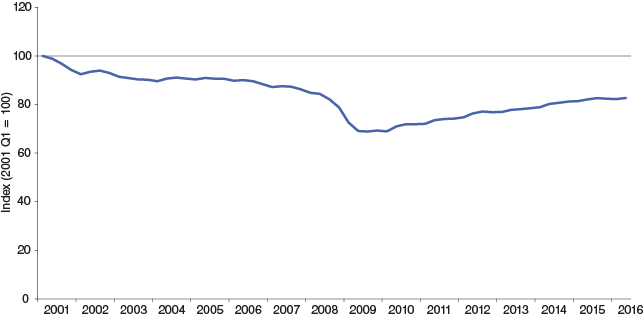
Indiana’s manufacturing sector employs more than 522,000 people, accounting for 17 percent of jobs, as of the second quarter of 2016—the largest share of any industry sector (health care and social services follows at 14 percent of all jobs). This is down 17 percent from 2001 levels (109,333 fewer jobs), but up more than 87,200 jobs from the employment levels experienced during the Great Recession (see Figure 1).
Figure 1: Indiana’s manufacturing employment indexed to 2001
Source: Quarterly Census of Employment and Wages data from the U.S. Bureau of Labor Statistics
However, looking at manufacturing as a whole can only tell us so much. This article explores the employment changes for Indiana’s 21 manufacturing subsectors over the past 15 years.
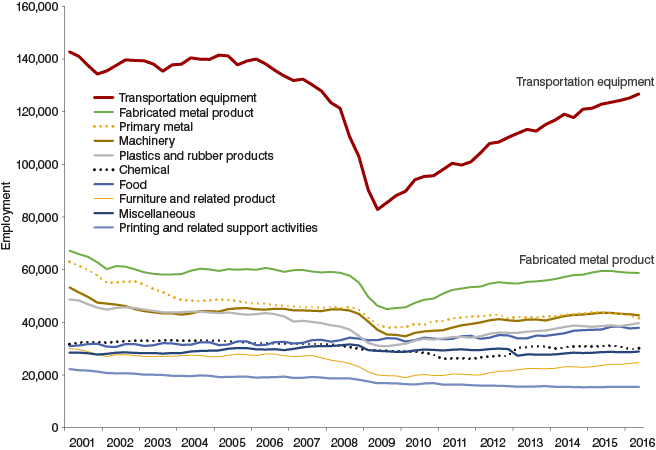
The 10 largest subsectors comprise 86 percent of all manufacturing employment in the state. Figure 2 illustrates both the dominance of transportation equipment over the state’s manufacturing sector, as well as the dramatic hit it took during the Great Recession and its subsequent recovery.Figure 2: Jobs over time in Indiana’s 10 largest manufacturing subsectors
Source: Quarterly Census of Employment and Wages data from the U.S. Bureau of Labor Statistics
Table 1: Indiana’s 10 largest manufacturing subsectors, 2016 Q2
| Manufacturing subsector | Establishments | Jobs | Average weekly wage | Change in jobs since 2001 Q1 |
|---|---|---|---|---|
| Transportation equipment | 586 | 126,772 | $1,198 | -11.2% |
| Fabricated metal product | 1,703 | 58,788 | $907 | -12.6% |
| Machinery | 812 | 42,710 | $1,176 | -19.9% |
| Primary metal | 201 | 41,624 | $1,393 | -33.9% |
| Plastics and rubber products | 488 | 39,755 | $885 | -18.4% |
| Food | 517 | 37,913 | $856 | 22.2% |
| Chemical | 308 | 30,154 | $1,727 | -4.9% |
| Miscellaneous | 573 | 28,951 | $1,062 | 1.6% |
| Furniture and related product | 488 | 24,772 | $775 | -17.6% |
| Printing and related support activities | 601 | 15,505 | $777 | -30.4% |
Note: Bold cells indicate subsectors that have increased employment since 2001 Q1.
Source: Quarterly Census of Employment and Wages data from the U.S. Bureau of Labor Statistics
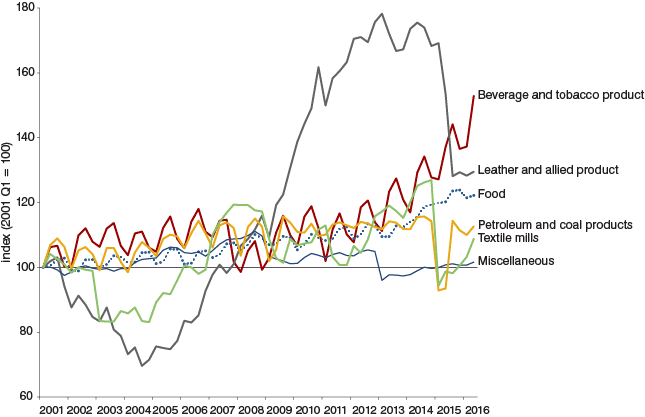
Out of all 21 subsectors, six have higher employment levels in 2016 relative to 2001 (see Figure 3). In percentage terms, beverage and tobacco product manufacturing tops the list, with a 53 percent increase in jobs since 2001—followed by leather and allied product manufacturing with a 30 percent increase.
Figure 3: Indiana manufacturing subsectors that increased employment since 2001 Q1
Source: Quarterly Census of Employment and Wages data from the U.S. Bureau of Labor Statistics
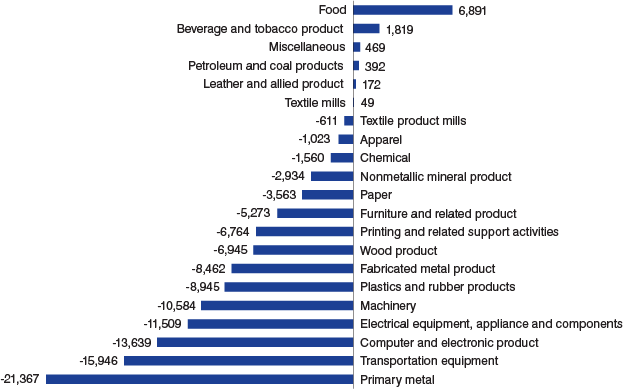
However, in numeric terms, food manufacturing accounts for the most new jobs (nearly 6,900) among manufacturing subsectors in the past 15 years (see Figure 4).
Figure 4: Job change in Indiana manufacturing subsectors, 2001 Q1 to 2016 Q2
Source: Quarterly Census of Employment and Wages data from the U.S. Bureau of Labor Statistics
At the other end of the spectrum, primary metal manufacturing and transportation equipment manufacturing account for the largest employment losses in numeric terms since 2001, with declines exceeding 21,300 and 15,900 jobs, respectively. In percentage terms, some of the state’s smaller subsectors, including apparel manufacturing and electrical equipment, appliance and components manufacturing, experienced losses exceeding half of their 2001 workforce (see Table 2).
Table 2: Indiana's manufacturing subsectors, 2016 Q2
| Manufacturing subsector | Establishments | Jobs | Average weekly wage | Change in jobs since 2001 Q1 |
|---|---|---|---|---|
| Total manufacturing | 8,098 | 522,469 | $1,087 | -17.3% |
| Beverage and tobacco products | 147 | 5,258 | $769 | 52.9% |
| Leather and allied products | 14 | 755 | $978 | 29.5% |
| Food | 517 | 37,913 | $856 | 22.2% |
| Petroleum and coal products | 50 | 3,487 | $1,795 | 12.7% |
| Textile mills | 25 | 606 | $725 | 8.8% |
| Miscellaneous | 573 | 28,951 | $1,062 | 1.6% |
| Chemical | 308 | 30,154 | $1,727 | -4.9% |
| Transportation equipment | 586 | 126,772 | $1,198 | -11.2% |
| Fabricated metal product | 1,703 | 58,788 | $907 | -12.6% |
| Textile product mills | 151 | 3,170 | $666 | -16.2% |
| Nonmetallic mineral product | 408 | 14,049 | $988 | -17.3% |
| Furniture and related product | 488 | 24,772 | $775 | -17.6% |
| Plastics and rubber products | 488 | 39,755 | $885 | -18.4% |
| Machinery | 812 | 42,710 | $1,176 | -19.9% |
| Paper | 142 | 9,745 | $971 | -26.8% |
| Printing and related support activities | 601 | 15,505 | $777 | -30.4% |
| Wood product | 497 | 14,265 | $750 | -32.7% |
| Primary metal | 201 | 41,624 | $1,393 | -33.9% |
| Computer and electronic product | 207 | 14,630 | $1,130 | -48.2% |
| Electrical equipment, appliance and components | 144 | 8,808 | $918 | -56.6% |
| Apparel | 36 | 752 | $655 | -57.6% |
Source: Quarterly Census of Employment and Wages data from the U.S. Bureau of Labor Statistics
Summary
Despite recent gains in manufacturing relative to the employment lows experienced during the Great Recession, Indiana’s manufacturing employment remains about 17 percent lower than 15 years earlier. However, productivity has increased primarily due to advanced technology. It is important to note that manufacturing comprises the largest private industry component of Indiana’s gross domestic product at $87 billion in 2015 and ranks fifth nationwide.
Also significant is the variation of employment losses and gains over the past 15 years, with employment levels changing anywhere from -58 percent to +53 percent since 2001. A handful of subsectors have experienced overall employment gains since 2001 (most notably, food manufacturing), but those gains are overshadowed by the larger jobs losses in most of the other subsectors.
More information can be found on STATS Indiana—just go to the Employment and Wages topic page or check out the States IN Profile tool to compare Indiana’s economy to other states.
