Slowing Population Growth
The latest population estimates from the U.S. Census Bureau indicate that Indiana, like much of the Midwest, continued to experience slow population growth in 2015. The state added 21,800 residents in 2015—a 0.3 percent increase over the previous year.
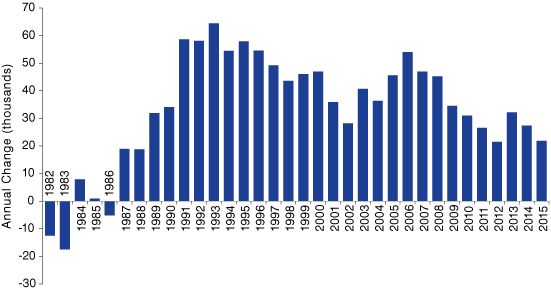
As Figure 1 shows, this was Indiana’s second-smallest annual population gain since 1989, and well below the level of growth seen during much of the last quarter century. To put the state’s recent population trend in perspective, Indiana’s average annual population gain of nearly 26,000 residents per year between 2011 and 2015 stands at less than half of the average mark set during the 1990s (53,600 per year) and well below the 2000s (40,300 per year).
Figure 1: Indiana Annual Population Change
Source: U.S. Census Bureau
The one consolation in last year’s population numbers was that Indiana’s rate of growth in 2015 outpaced each of its neighboring states, but it ranked as just the 30th fastest growing state nationally. With nearly 6.62 million residents, Indiana was the nation’s 16th most populous state in 2015.
Population Slowdown Evident in Most Counties
Looking county-by-county, this population slowdown was widespread around the state. In fact, nearly three out of every four counties in Indiana saw a level of population change in 2015 that was lower than its average annual change from 2000 to 2010.
Lake County has experienced the largest reversal in its population trends with an estimated decline of 2,709 residents in 2015, compared to an average annual gain of 1,144 people per year in the 2000s.
Some suburban communities in the Indianapolis area and in Northwest Indiana, while still continuing to grow, had the next-largest reductions in population growth between these two periods. Hamilton County, for instance, led all Indiana counties in 2015 with an increase of 6,419 residents, but this mark was below the county’s average annual gain of 9,183 from 2000 to 2010. Porter and Hendricks counties have seen even more dramatic relative slips in growth.
Among the Indiana communities that have bucked this slowing trend, St. Joseph, Boone, Bartholomew, Allen and Elkhart counties had the largest increases in population change in 2015 compared to their annual averages in the 2000s.
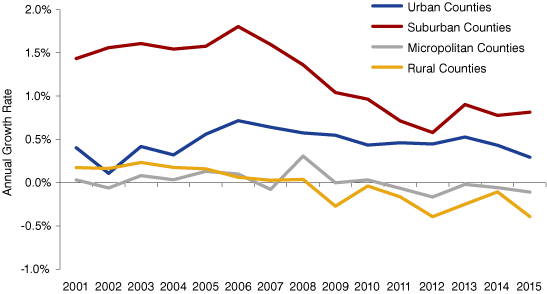
As Figure 2 illustrates, though, when we organize each county into a broad community type, we see that each category has experienced a decline in growth in recent years. The state’s suburban counties, for instance, combined to grow at an average annual rate of 1.6 percent per year between 2000 and 2008. Since the onset of the Great Recession, however, the rate of growth for these communities has dropped by half to 0.8 percent annually.
Figure 2: Annual Population Growth by County Type
Source: U.S. Census Bureau
Compared to suburban counties, growth in the state’s 13 urban counties has been relatively stable since 2010, but did slip to 0.3 percent in 2015—the smallest one-year growth rate for this collection of counties since 2002. Slower growth last year in the state’s two largest counties—Marion and Lake—was the cause for the decline in this group. Indiana’s rural counties, as well as those designated as micropolitan counties (i.e., counties with a city or town that has a population between 10,000 and 50,000 residents), both combined to post population gains on average between 2000 and 2008, but have lost residents since the recession.
Causes of Slower Growth
Population change is driven by two forces—migration and natural increase (more births than deaths)—and both of these factors are contributing to slower growth in the state. In terms of migration, Indiana averaged a net in-migration of roughly 17,600 residents per year during the 1990s and nearly 9,200 annually in the 2000s.1 Over the last five years, however, the state’s average annual net inflow has dropped to an estimated 2,200 residents per year. Indiana had a net out-migration of 2,300 residents in 2015.
Just as migration has stalled since the Great Recession, birth rates have declined too. According to the Indiana State Department of Health, Indiana averaged more than 87,300 births per year during the 2000s, but the annual births in the state have dropped to roughly 83,600 since. This decline has occurred even though the number of women in the state between the ages of 20 and 34 has increased sharply in recent years as the so-called millennial generation comes of age.
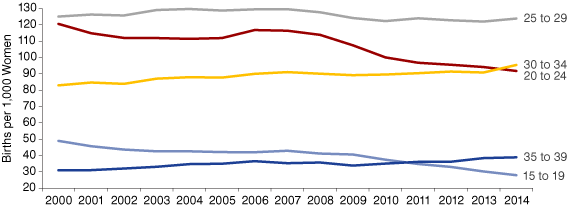
There is both good news and bad news in Indiana’s lower fertility rates. One significant positive development is that the state’s teen birth rate has declined by 43 percent between 2000 and 2014 (see Figure 3). The birth rate for the 20-to-24 age group is down in a big way, too, falling from 117 births per thousand women in 2006 to 92 in 2014. The birth rate for this group has fallen to the extent that the 30-to-34 age group had a higher mark in 2014—almost certainly a first in Indiana. This decline likely reflects a number of factors, including higher college enrollment rates and a host of economic pressures (such as higher unemployment for young adults and an expanding role for women as breadwinners).2
Figure 3: Indiana Age-Specific Birth Rates, 2000 to 2014
Source: Indiana State Department of Health and U.S. Census Bureau
The decline in fertility among younger adults has been offset somewhat by rising birth rates for Hoosier women in their 30s, but these increases are not yet strong enough to make up the entire difference. To help put these shifts in perspective, if Indiana’s average annual age-specific birth rates between 2004 to 2009 were in effect in 2014, the state would have had nearly 7,000 additional births in that year.
While births are down, the number of deaths in the state is on the rise—and will continue to climb over the next couple of decades as the baby-boom generation ages. In recent years, then, each of the primary drivers of population change has been a drag on Indiana’s growth.
Focus on 2015: Indy-Area Suburbs Set the Pace
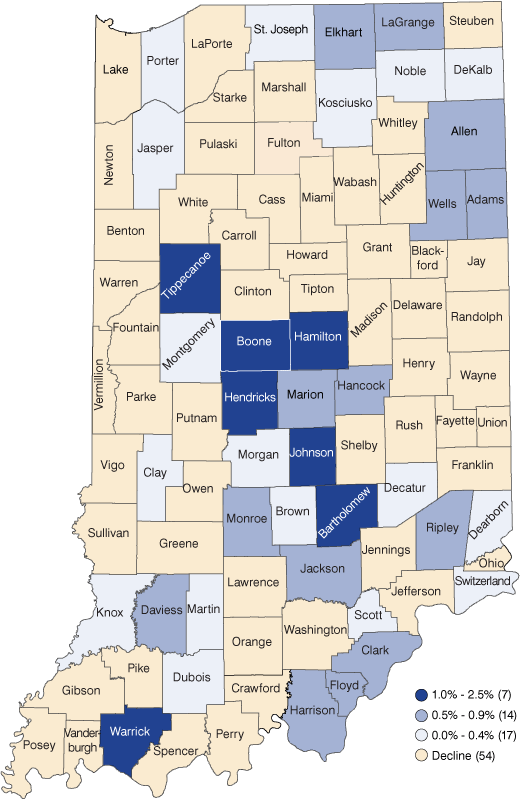
Looking at 2015 alone, Indiana’s four fastest growing counties were all in the Indianapolis metro area (see Figure 4). Boone County led the way for the second consecutive year with a 2.5 percent increase, followed by Hamilton County (2.1 percent), Johnson County (1.5 percent) and Hendricks County (1.4 percent).
Figure 4: Percent Change in Population, 2014 to 2015
Source: U.S. Census Bureau
Bartholomew County was the fastest growing county outside of the Indianapolis metro area with a 1.2 percent pace of growth in 2015. The rest of the state’s top 10 counties were Tippecanoe (1.2 percent increase), Warrick (1.0 percent), Clark (0.9 percent), LaGrange (0.9 percent) and Harrison (0.9 percent).
In terms of the largest numeric gains, Hamilton County posted the state’s largest increase, adding 6,419 residents in 2015. Marion County was second, gaining 4,489 residents. For Marion County—which had seen a surge in population growth from 2009 to 2013—the 2015 increase was its smallest one-year gain since 2005. Other top gainers include Allen (2,749), Tippecanoe (2,156) and Johnson (2,144) counties.
All told, 54 of Indiana’s 92 counties lost population in 2015. Lake County had the largest decline with an estimated loss of 2,709 residents. LaPorte County had the state’s second-largest drop at 811 residents, followed by Grant (-652), Wayne (-446) and Cass (-357) counties. In terms of the pace of decline, Parke County led the state last year with a 1.9 percent decline. Crawford (-1.4 percent), Ohio (-1.2 percent), Tipton (-1.0 percent) and Rush (-1.0) counties also posted significant losses in population last year.
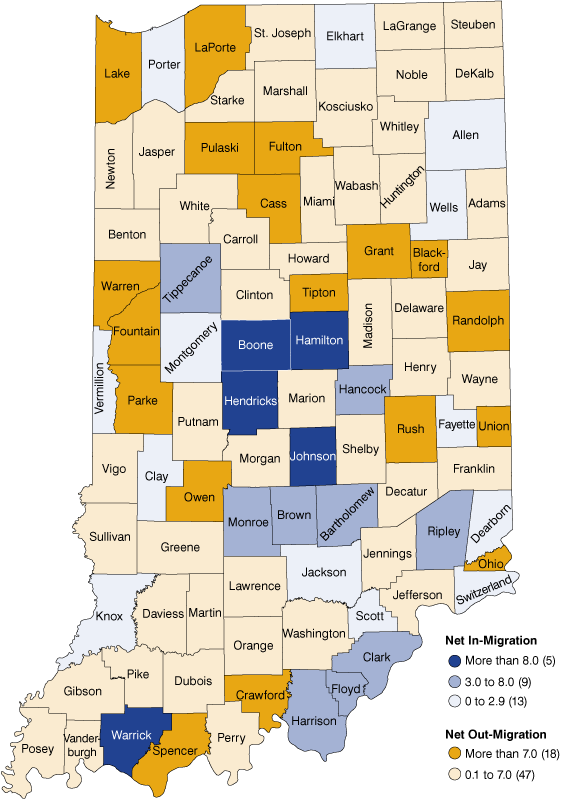
A net out-migration of residents was the primary driver of decline in nearly all of these communities, as 65 Indiana counties had more people move away last year than they had move in. Lake County led this trend with an estimated net outflow of 3,776 movers in 2015, while Marion (-1,638) and LaPorte (-898) counties had the next-largest net outflows. Parke County had the state’s greatest rate of net out-migration last year at a net loss of nearly 20 movers per 1,000 residents in 2015 (see Figure 5).
Figure 5: Net Migration per 1,000 Residents, 2015
Source: U.S. Census Bureau
At the other end of the spectrum, Hamilton (4,104), Johnson (1,433), Hendricks (1,271) and Boone (1,164) counties in the Indianapolis metro area had the largest net in-migration of residents in 2015, followed by the university-driven communities in Tippecanoe (999) and Monroe (703) counties. Boone County had the state’s greatest net in-migration rate at more than 18 movers per 1,000 residents.
Indiana’s Largest Counties
Indiana has six counties with populations greater than 200,000. Marion County is the state’s largest with 939,020 residents, ranking it as the nation’s 52nd most populous county in 2015 (out of 3,142 counties). Other large counties in the state include Lake (487,865), Allen (368,450), Hamilton (309,697), St. Joseph (268,441) and Elkhart (203,474).
Rounding out the 10 largest counties in the state are Tippecanoe (185,826), Vanderburgh (181,877), Porter (167,688) and Hendricks (158,192).
Indiana’s Metropolitan Areas
The 11-county Indianapolis-Carmel-Anderson metro area continues to drive population growth in the state. With an increase of nearly 17,000 residents last year, this region accounted for roughly 78 percent of Indiana’s net growth in 2015. The Indy metro area is home to nearly 1.99 million people, which represents 30 percent of the state’s population and ranks as the nation’s 34th-largest metro area (out of 381 metros).
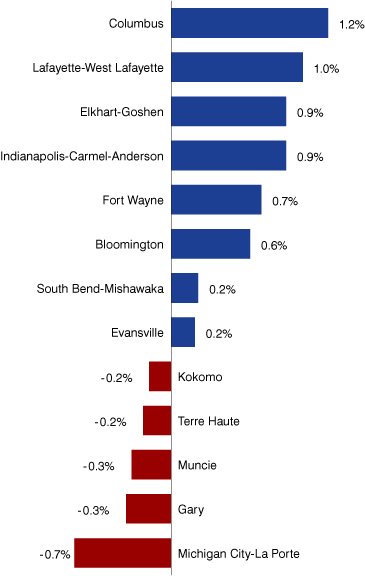
Compared to large metro area peers in neighboring states, the Indy area’s growth rate of 0.9 percent in 2015 was lower than Columbus, Ohio (1.2 percent), but it outpaced Louisville (0.6 percent), Cincinnati (0.4 percent), Detroit (0.0 percent), Chicago (-0.1 percent) and Cleveland (-0.2 percent).
The three-county Fort Wayne area is the state’s second-largest metro area with 429,820 residents. The Fort Wayne metro area posted a 0.7 percent increase in 2015 (see Figure 6), ranking as the 125th-largest metro area in the nation. Indiana’s other large metro areas also grew last year, including South Bend-Mishawaka (0.2 percent), Evansville (0.2 percent), Lafayette-West Lafayette (1.0 percent) and Elkhart-Goshen (0.9 percent).
Figure 6: Population Growth Rates for Indiana Metro Areas, 2014 to 2015
Source: U.S. Census Bureau
In all, 44 of Indiana’s 92 counties belong to a metropolitan area. These counties combined to account for 78 percent of Indiana’s total population, and as a group grew at a 0.5 percent rate in 2015. The state’s 48 counties that are not part of a metro area had a combined population loss of 2,937 residents last year—a 0.2 percent decline.
Conclusion
Eight years after the start of the Great Recession, Indiana is still experiencing sluggish population growth. All of the primary components of population change are playing a role in this slowdown. Fertility rates are low, but there is certainly room for a rebound in births in the near term if the economy stays solid. However, as baby boomers age, the number of deaths in Indiana will continue to climb, so on balance, natural increase will contribute less and less to Indiana’s population growth over the next two or three decades. This is especially true for many of Indiana’s mid-sized and rural counties.
That leaves migration as the one avenue through which many Indiana communities could see stronger population growth in the future, or at least stem the tide of population loss. Indiana has had periods of strong migration in the recent past, and there may be some natural bounce back in this measure as the employment situation continues to improve. Looking further ahead, however, sustained population growth through migration will likely rely on improvements in the economic, educational and quality of place characteristics of our communities.
Notes
- Richelle Winkler, Kenneth M. Johnson, Cheng Cheng, Jim Beaudoin, Paul R. Voss, and Katherine J. Curtis, “Age-Specific Net Migration Estimates for US Counties, 1950-2010,” Applied Population Laboratory, University of Wisconsin- Madison, 2013, www.netmigration.wisc.edu/.
- Mark Mather, “The Decline in U.S. Fertility,” World Population Data Sheet, 2014, Population Reference Bureau, www.prb.org/Publications/Datasheets/2014/2014-world-population-data-sheet/us-fertility-decline-factsheet.aspx.
