Radon: A public health issue that hurts the poor the most
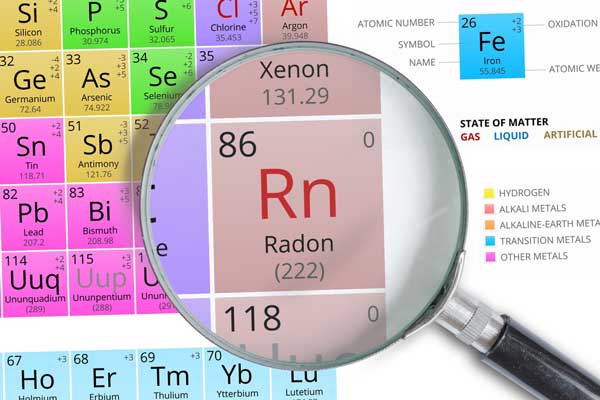
Radon is a naturally occurring odorless and tasteless radioactive gas that originates from the decay of uranium within rock, soil and water.
A recent New York Times article drew attention to new research highlighting health inequality in the United States.1 While the richest Americans enjoy longer lifespans across the nation, the life expectancy for the poor varies greatly by metro area. The majority of the variation in life expectancy by location is tied to health behaviors, including smoking and exercise.2
Indiana is one of the states where the life expectancy among the poor is significantly lower than the national average. These below-average results may be partially attributed to the fact that Indiana has the seventh-highest rates of both smoking3 and obesity4 in the nation, but certainly a person’s life expectancy boils down to more than these two simplified factors. In this article, we will take a closer look at an environmental factor that directly affects health but lacks public awareness: radon.
What is radon and why does it matter?
Radon is a naturally occurring odorless and tasteless radioactive gas that originates from the decay of uranium within rock, soil and water. Radon is found all over the world, but certain locations release more radon into the air due to the geological makeup of the land. In places with high releases of radon, it can accumulate to unsafe levels within buildings. Over time, breathing radon can cause lung cancer—and the risk of cancer grows as radon concentrations increase.
Radon is the leading cause of lung cancer for non-smokers, and the Environmental Protection Agency (EPA) estimates radon causes 21,000 deaths per year from lung cancer.5 Figure 1 compares the estimated annual number of deaths from radon to other selected causes. Even though radon exposure is responsible for more deaths each year than fires, asbestos-related cancer, and carbon monoxide poisoning combined, it lacks the widespread awareness of those home dangers.
Figure 1: Annual number of deaths by cause in the United States
*Mesothelioma is a specific type of cancer caused by prolonged exposure to asbestos
Source: IBRC, using data from the Environmental Protection Agency, the Centers for Disease Control and Prevention, The Mesothelioma Center, and the U.S. Fire Administration
Which levels of radon are unsafe?
Remediation action is recommended for indoor concentrations of radon that equal or exceed 4.0 picocuries per litre (pCi/L). A lifetime of breathing air with a 4.0 pCi/L radon concentration would result in about 62 out of 1,000 smokers developing lung cancer. This risk of lung cancer is equivalent to five times the risk of dying in a car crash.5 For non-smokers, a lifetime of exposure to a 4.0 pCi/L radon concentration would result in approximately seven out of 1,000 people developing lung cancer, which is equivalent to the risk of dying in a car crash. As radon concentrations increase, the risk of developing lung cancer for both smokers and non-smokers rises.
How to minimize radon
The only way to know whether there are unsafe levels of radon in your home or other building is to conduct a radon test. If the test results are at actionable levels, a radon mitigation system should be installed to reduce the indoor concentration of radon. In Indiana, and in many other states, there are professional licenses for radon testers, mitigators and laboratory testers. Builders and contractors can also become licensed in radon-resistant construction techniques to minimize radon in new buildings.
Radon in Indiana
Due to the geology in Indiana, many buildings contain unsafe levels of radon. To help people understand the risk of radon in their area, the EPA has developed a zonal risk map of all U.S. counties. Figure 2 displays the EPA zones in Indiana, as well as the percent of homes in each county that had radon test results equal to or greater than 4.0 pCi/L between 2007 and 2014. It also outlines the 12 counties with the highest test results, above 70 pCi/L, in 2014.
Two of the counties with buildings that had over 70 pCi/L test results are in radon zone 2, which the EPA predicts will have average test results between 2 and 4 pCi/L. These high results highlight how important it is for all homes, offices, and schools to conduct radon tests because the actual indoor radon concentrations could be much higher than anticipated.
Figure 2: Percent of homes with radon test results above 4 pCi/L
Note: Labels show the percent of homes in each county that had radon test results equal to or greater than 4.0 pCi/L between 2007 and 2014.
Source: Indiana State Department of Health and the Environmental Protection Agency
How radon disproportionately affects the poor
Public awareness is the first barrier to taking action against radon. A 2015 American Institute for Cancer Research survey found that only 59 percent of Americans are aware that radon causes cancer.6 However, knowledge of radon varies by income level. While there is no national survey on radon awareness, some states have conducted their own surveys. The Colorado Department of Health and Environment conducted a survey in 2009 and found that only 37 percent of residents with an income less than $15,000 were aware of radon, while 85 percent of residents with incomes above $50,000 had knowledge of radon (see Figure 3).7
Figure 3: Percent of Colorado residents with knowledge of radon
Note: The error bars indicate the survey’s margin of error.
Source: IBRC, using Behavioral Risk Factor Surveillance System data from the Colorado Department of Public Health and Environment
Cost is the second obstacle to reducing radon exposure. Even if a low-income household is aware of the risk of radon, they may not have funds available for radon testing. Licensed radon professionals charge more than $100 for radon tests, though subsidized home test kits cost $15 to $25 through the American Lung Association. The Colorado radon survey results show that low-income households are significantly less likely to test for radon than higher income households (see Figure 4).
Figure 4: Percent of Colorado residents who had their homes tested for radon
Note: The error bars indicate the survey’s margin of error.
Source: IBRC, using Behavioral Risk Factor Surveillance System data from the Colorado Department of Public Health and Environment
The third barrier to reducing radon exposure is the cost to install a mitigation system. The Indiana State Department of Health estimates that the average cost of installing a radon mitigation system is between $800 and $1,200 depending upon the area and the type of system installed. For households already struggling financially, saving up enough for a radon mitigation system is extremely difficult.
The final, and perhaps most significant, hurdle in minimizing radon exposure is the lack of radon legislation for rental properties. Only a handful of states have specific laws pertaining to radon and rental properties. In states without these specific laws (including Indiana), the only form of recourse is for tenants to claim that high radon levels render the property non-habitable. This may provide a legal means for the renter to break their lease if the landlord refuses to install a radon mitigation system, but the tenant would be forced to bear the cost of moving. The lack of legislation puts an unjust burden on low-income households, as they are more likely to rent than own. In 2014, the median income level for Indiana households that rented was $29,083, while the median income for the state’s owner-occupied households was $60,830.8
Combined, all of these barriers make it nearly impossible for low-income families to minimize exposure to radon within their homes. Even more damaging is that low-income households have a greater need for radon mitigation because many already face higher risks of lung cancer due to smoking. The CDC estimates that 26.3 percent of people below the poverty level smoke, while only 15.2 percent of people at or above the poverty level smoke.9
Conclusion
It’s important to remember that while radon is a serious public health issue, it is only one small contributor to the overall health of a person. Total health care must balance improving personal health behaviors, reducing environmental hazards, managing current ailments and preventing future ones.
However, in order to help low-income households overcome the obstacles to radon mitigation, all forms of government should work together to develop targeted programs to raise awareness and subsidize testing and mitigation costs. In addition, more states, Indiana included, need to adopt legislation that provides tenants with legal rights regarding radon testing and mitigation in rental properties.
Notes
- Neil Irwin and Quoctrung Bui, "The Rich Live Longer Everywhere. For the Poor, Geography Matters," The New York Times, April 11, 2016.
- Raj Chetty, Michael Stepner, Sarah Abraham, Shelby Lin, Benjamin Scuderi, Nicholas Turner, Augustin Bergeron, and David Cutler, "The Association between Income and Life Expectancy in the United States, 2001-2014." The Journal of the American Medical Association 315, no. 14 (2016).
- Justin McCarthy, "In U.S., Smoking Rate Lowest in Utah, Highest in Kentucky." Gallup. March 13, 2014, www.gallup.com/poll/167771/smoking-rate-lowest-utah-highest-kentucky.aspx.
- “Adult Obesity in the United States,” The State of Obesity: Better Policies for a Healthier America, September 21, 2015, http://stateofobesity.org/adult-obesity/.
- “Health Risk of Radon,” Environmental Protection Agency, May 17, 2016, www.epa.gov/radon/health-risk-radon.
- American Institute for Cancer Research, "The AICR 2015 Cancer Risk Awareness Survey Report," 2015, www.aicr.org/assets/docs/pdf/education/aicr-awareness-report-2015.pdf.
- Chrystine Kelley and Eric Brown, “Radon Awareness and Household Testing: Results from the Behavioral Risk Factor Surveillance System,” June 2011.
- U.S. Census Bureau, “Table B25119: Median Household Income the Past 12 Months (in 2014 Inflation-Adjusted Dollars) by Tenure,” 2014 American Community Survey 1-Year Estimates, American FactFinder, https://data.census.gov/table?q=median+household+income+2014&tid=ACSST1Y2014.S1901.
- “Current Cigarette Smoking among U.S. Adults Aged 18 Years and Older,” Centers for Disease Control and Prevention, December 14, 2015, www.cdc.gov/tobacco/campaign/tips/resources/data/cigarette-smoking-in-united-states.html.