Indiana Reaches Important Housing Milestones in 2015
At this time last year, declining home sales raised some concerns that Indiana’s strong housing recovery may be running out of steam. This slowdown proved to be short-lived, however, as a return to climbing homes sales was one of a number of key housing indicators to show marked improvement over the last year. Home sales over a 12-month period ending in June 2015 were up more than 6 percent over the same stretch a year earlier. Buyer demand was so strong this summer that Hoosiers purchased 9,080 existing homes in June alone—the state’s second-largest one-month sales tally in the last 12 years.
The state reached a couple of other important milestones in 2015. According to the Federal Housing Finance Agency, Indiana’s house prices in the first quarter of 2015 finally eclipsed their pre-recession peak, meaning that the state’s home values have now recovered all of the ground they lost in the wake of the housing slump. Indiana’s foreclosure rate, meanwhile, has been cut by more than half since the end of 2011, and now sits at its lowest point in 14 years.
Residential construction is the one area of the housing market that continues to lag (see Table 1). After construction nosedived with the Great Recession, Indiana had seen modest gains in this industry during 2012 and 2013, driven in part by a surge in new multi-family developments. Apartment construction has slowed so far in 2015, though, and the number of new housing units permitted for construction through the first seven months of this year is down nearly 11 percent compared to the same period in 2014.
Table 1: Indiana Housing Market by the Numbers
| Indicator | U.S. | Indiana |
|---|---|---|
| Existing Home Sales, July 2014 to June 2015, Year-over-Year Change | 3.2% | 6.2% |
| House Price Appreciation, 2014 Q1 to 2015 Q1 | 5.8% | 3.5% |
| Residential Building Permits, July 2014 to June 2015, Year-over-Year Change | 10.3% | -2.9% |
| Foreclosure Rate, 2015 Q2 | 2.1% | 2.3% |
| Share of Mortgages with Negative Equity, 2015 Q2 | 8.7% | 4.1% |
Sources: Indiana Association of Realtors, National Association of Realtors, Federal Housing Finance Agency, U.S. Census Bureau, Mortgage Bankers Association and CoreLogic
The inventory of existing homes for sale continues to be exceptionally low, and rental vacancy rates are down as well. These trends should eventually translate into demand for new construction, as long as the economy continues to improve. Fortunately, Indiana has posted relatively strong economic numbers of late. As of July 2015, the state has added 63,900 jobs in the last year, and its unemployment rate dropped 1.1 percentage points over the same period.
The latest data on Hoosier incomes raise some red flags, however. The Census Bureau reports that the state’s median household income declined a bit in 2014, and growth in Indiana’s per capita personal income was outpaced by the U.S. for the first time in the last five years.Many aspects of the Indiana housing market are back on track, but the recovery isn’t complete. The state’s economy will have to continue to improve for the market to begin to hit on all cylinders.
Home Sales Activity on the Rise Again in 2015
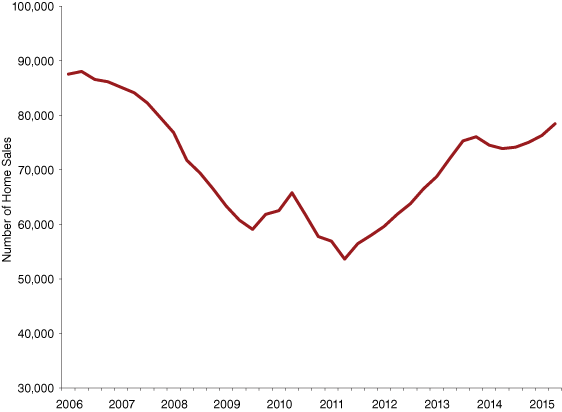
After a couple years of strong gains in existing home sales, buyer demand tailed off in 2014. This slowdown turned out to be temporary, however, as existing home sales are off to a quick start again this year. Sales in the second quarter of 2015 were 10 percent higher than during the same period in 2014, and 7 percent higher than the second quarter of 2013. Looking over the past year (i.e., third quarter 2014 to second quarter 2015), Indiana had roughly 78,440 sales—the state’s largest four-quarter total since the end of 2007 (see Figure 1).
Figure 1 : Indiana Home Sales, Moving Four-Quarter Total, 2006 Q1 to 2015 Q2

Source: Indiana Association of Realtors
Fluctuations in mortgage rates have certainly contributed to the ebb and flow in existing home sales. After jumping a full percentage point in 2013, the 30-year conventional rate began to fall again in a big way late last year and held below the 4 percent mark through the first half of 2015, which no doubt boosted demand during the spring and summer selling season. The Federal Reserve will almost certainly begin to raise the federal funds rate later in 2015, which should push mortgage rates higher as well. The degree to which the market is able to tolerate the higher mortgage rates we are likely to see will be one of the key questions facing the Indiana housing market over the next year.
House Prices Continue to Climb
As demand picks up, house prices are also climbing. At $126,000 last year, the state’s median sales price for existing homes increased more than 3 percent for the third consecutive year.
Other measures show that Indiana’s house prices are improving as well. According to the Federal Housing Finance Agency’s House Price Index (HPI), Indiana has seen price appreciation for 13 consecutive quarters dating back to early 2012 and the state’s home prices in the first quarter of 2015 are up 3.5 percent year-over-year.1 This rate of appreciation ranked 40th-fastest among states and was the lowest among all Midwestern states except South Dakota (3.3 percent). Michigan had the highest change of any state (10.9 percent), while neighboring Kentucky (4.8 percent), Illinois (4.0 percent), and Ohio (3.8 percent) were closer to Indiana levels.
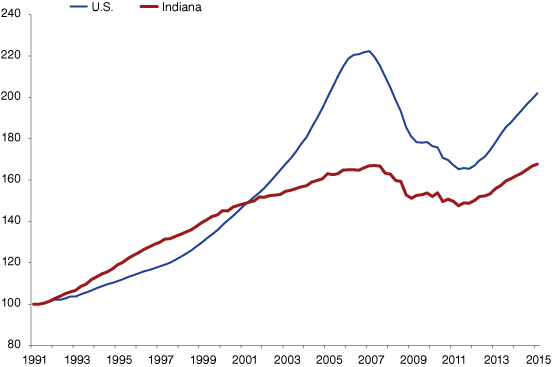
It is important to note that comparing states based on one-year growth rates can be a little misleading. States like Michigan, Ohio and Illinois are outpacing Indiana now because they are rebounding from far more severe price declines through the housing bust. House prices in Michigan declined by 45 percent after the crash. Ohio and Illinois saw drops of 25 percent and 32 percent, respectively. Indiana had a comparatively mild 12 percent slide in prices between 2007 and 2011. In the first quarter of 2015, the HPI for Indiana exceeded its pre-recession peak (see Figure 2). House prices in Michigan and Illinois, by contrast, are both still more than 20 percent below their respective peaks, and Ohio is 13 percent off its previous high.
Figure 2: House Price Index, 1991 Q1 to 2015 Q1

Source: Federal Housing Finance Agency, House Price Index (expanded data series, seasonally adjusted)
Indiana Foreclosure Rate at Lowest Level since 2001
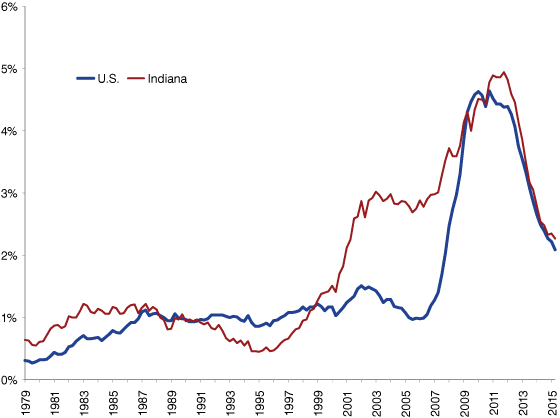
One factor helping to boost house prices is the dramatic decline in foreclosures. According to the Mortgage Bankers Association, the state’s foreclosure rate has declined more than 2.5 percentage points from 4.96 in the fourth quarter of 2011 to 2.27 in mid-2015, which is the state’s lowest rate since 2001 (see Figure 3). Even with this drop, however, Indiana’s foreclosure rate remains slightly above the U.S. average and ranks 17th-highest among states.
Figure 3: Share of Mortgages in Foreclosure, 1979 Q1 to 2015 Q1

Source: National Delinquency Survey, Mortgage Bankers Association
Residential Construction Remains Weak
The one area of the housing market that has yet to gain much traction is residential construction. The state saw a decent jump in new units in 2013, but activity has faded since. The number of permitted units in Indiana dipped by a little less than 1 percent in 2014. Through July 2015, new permitted units are down by 11 percent compared to the first seven months of 2014.
The primary reason for the decline in new units has been a recent slowdown in multi-family development. Apartment construction accounted for 30 percent of all new permitted units in 2013, and roughly 28 percent of the total in 2014—the two highest shares since 1986. So far in 2015, however, permits for new apartment units are down nearly 39 percent year-over-year and account for roughly 19 percent of all permits.
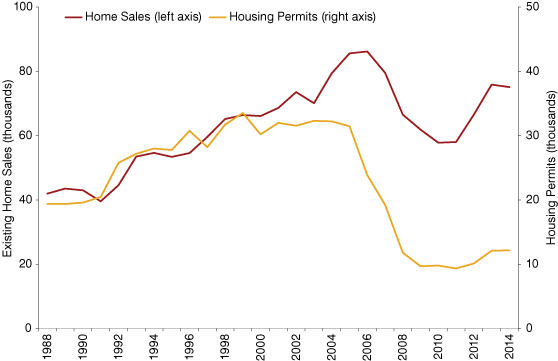
The gap between the number of existing home sales and permits for new single-family homes highlights the extent to which construction is lagging. From 1988 to 2005, there was a fairly consistent ratio of approximately two existing home sales for each single-family housing permit in Indiana (see Figure 4). In 2014, however, that ratio was roughly six-to-one. This gap is widening so far in 2015 as sales climb and single-family permits have declined year-over-year through July. Given the current situation of strong buyer demand but low inventory of existing homes for sale, the demand for new homes is bound to improve over the next few years.
Figure 4: Indiana Existing Home Sales and Single-Family Housing Permits

Source: U.S. Census Bureau, Moody’s Economy.com, Indiana Association of Realtors
Looking Ahead
Many of Indiana’s key housing market indicators have shown strong improvement in the last year. Most notably, the state’s existing home market has heated up in 2015, with existing home sales through the first half of the year up 10 percent over the same period in 2014. House prices continued to climb, as well, and the state’s foreclosure rate is still falling.
In the next year or two, expect these measures to remain strong, but they will likely transition from recovery-mode to patterns that are more stable. The days of double-digit increases in the rate of change in home sales or a foreclosure rate in free fall should be replaced by less dramatic trends that are driven by the unique economic and demographic fundamentals in local markets.
Of course, the one area that we hope will finally kick into recovery-mode is residential construction. The extremely low inventory of existing homes for sale and lower vacancy rates suggest a tightening housing market, which should spur demand for new construction. As always, though, factors such as the direction of interest rates and the strength of the economy will determine whether demand strengthens throughout the Indiana housing market.
Notes
- An HPI like this one from the Federal Housing Finance Agency is conceptually different from the median sales price indicator discussed earlier. Comparing the median sales price from one period to another can be misleading since the median price is influenced by the mix of homes sold in each period. The HPI is a repeat-sales index, meaning that it measures the changes in sales price when a given property is sold multiple times. This approach removes a good deal of the comparability problems inherent in the median sales price.
