Indiana Manufacturing on a Roll
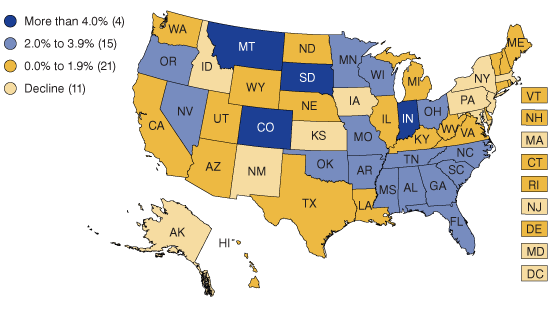
Indiana continues to rank first among states in the percent of its workforce engaged in manufacturing. It also ranked second in the nation in manufacturing employment growth over the past year. Indiana’s nonfarm employment grew by 1.8 percent, while Indiana manufacturing employment grew at a much more robust 4.5 percent between November 2013 and November 2014, according to the U.S. Bureau of Labor Statistics.1 Compare that growth to the nation’s manufacturing growth rate of 1.6 percent. Only Montana (4.8 percent) exceeded Indiana’s one-year growth rate in manufacturing (see Figure 1).
Figure 1: Change in Manufacturing Employment by State, 2013 to 2014

Source: STATS Indiana, using U.S. Bureau of Labor Statistics Current Employment Statistics non-seasonally adjusted data for November of each year
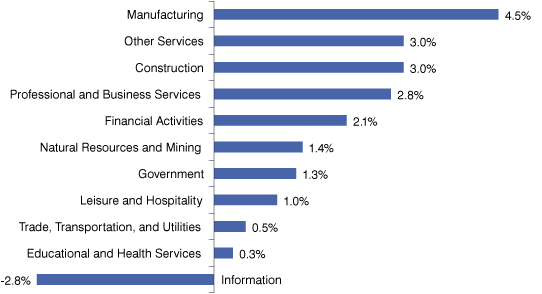
Manufacturing was Indiana’s fastest-growing sector during this time period, followed by “other services” and construction at 3 percent (see Figure 2). Only the information sector experienced an employment decline.
Figure 2: Percent Change in Indiana Employment by Sector, 2013 to 2014

Source: STATS Indiana, using U.S. Bureau of Labor Statistics Current Employment Statistics non-seasonally adjusted data for November of each year
In numeric terms, Indiana’s manufacturing firms added 22,600 workers in the past year to reach 520,800 employees by November 2014. Some of the state’s manufacturing subsectors saw more employment growth than others. Transportation equipment manufacturing led the pack with a 7.6 percent growth rate (see Table 1).
Table 1: Indiana Manufacturing Employment for Selected Subsectors
| Subsector | November 2014 Employment |
Change since November 2013 |
Percent Change |
|---|---|---|---|
| All Manufacturing | 520,800 | 22,600 | 4.5 |
| Durable Goods | 377,900 | 20,700 | 5.8 |
| Primary Metal | 43,400 | 1,300 | 3.1 |
| Fabricated Metal | 57,900 | 1,200 | 2.1 |
| Machinery | 41,800 | 1,400 | 3.5 |
| Computer & Electronic Product | 15,600 | -300 | -1.9 |
| Electrical Equipment, Appliance & Component | 8,400 | 0 | 0.0 |
| Transportation Equipment | 125,600 | 8,900 | 7.6 |
| Miscellaneous | 28,400 | 800 | 2.9 |
| Non-Durable Goods | 142,900 | 1,900 | 1.3 |
| Food | 35,100 | 300 | 0.9 |
| Chemical | 31,400 | 500 | 1.6 |
| Plastics Product | 31,600 | 800 | 2.6 |
Source: STATS Indiana, using U.S. Bureau of Labor Statistics Current Employment Statistics non-seasonally adjusted data
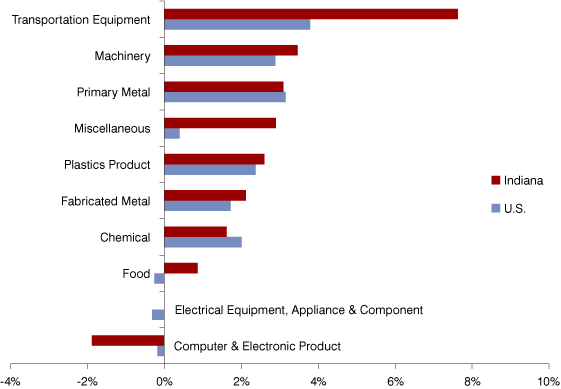
Overall, durable goods manufacturing in Indiana saw a 5.8 percent increase in jobs, while non-durable goods experienced 1.3 percent growth. This exceeds the U.S. growth rates of 2.3 percent and 0.4 percent, respectively. Figure 3 compares Indiana’s subsector growth to the U.S. as a whole. Indiana outpaced the national growth rates by more than 2 percentage points in both transportation equipment manufacturing and miscellaneous manufacturing.
Figure 3: Percent Change in Manufacturing Subsector Employment, 2013 to 2014

Source: STATS Indiana, using U.S. Bureau of Labor Statistics Current Employment Statistics non-seasonally adjusted data for November of each year
With all this wonderful news about manufacturing job growth, it is worth keeping in mind that manufacturing got hit hard by the Great Recession, and Indiana has yet to return to the 2007 levels when the sector employed 545,200 (and even before that, manufacturing employment had been steadily declining since 2000). That means Indiana is still 24,400 jobs below 2007 levels and more than 150,000 jobs below the 1999 peak. While we may not be back to manufacturing’s glory days, a few years of solid growth are always nice to see.
These Current Employment Statistics data are released monthly, so visit STATS Indiana’s Employment and Earnings topic page or States IN Profile to see how manufacturing employment (or any sector for that matter) is faring throughout the year.
