Indiana's Housing Market in 2014
Indiana has seen dramatic improvement in many key housing market indicators over the last couple of years. Existing home sales improved by 31 percent between 2011 and 2013 and the state’s foreclosure rate has dropped to its lowest level since early 2001. Indiana house prices have regained nearly all the ground lost during the slump, and even residential construction—although still well below historic norms—has shown signs of life.
So far in 2014, however, price gains and construction activity have moderated some, and existing home sales have taken a step back. Odd as it may sound though, these developments could also be seen as positive signs since they likely signal a move toward normalcy in housing. That is, for at least a decade, Indiana’s housing markets have been overly influenced by a series of national-level forces. Factors like easy lending, the Great Recession, federal homebuyer tax credits, historically low mortgage rates and bulk home purchases by investors have fueled booms and busts in local markets.
In 2014, these influences are either long gone or at least fading, which has helped to dampen some housing-related activity lately (see Table 1). Moving forward, the ups and downs in housing indicators are likely to be less dramatic as local markets increasingly sink or swim on the strength of their own economic and demographic fundamentals.
Table 1: Indiana Housing Market by the Numbers
| Indicator | U.S. | Indiana |
|---|---|---|
| Existing Home Sales, October 2013 to September 2014, Year-over-Year Change | -3.4% | -1.9% |
| House Price Appreciation, 2013 Q3 to 2014 Q3 | 6.0% | 3.3% |
| Residential Building Permits, October 2013 to September 2014, Year-over-Year Change | 6.0% | 10.6% |
| Share of Mortgages That Are Seriously Delinquent, 2014 Q3 | 4.7% | 5.1% |
| Share of Mortgages with Negative Equity, 2014 Q2 | 10.7% | 5.1% |
| Household Formation Rate, 2013 | 0.3% | 0.7% |
Sources: Indiana Association of Realtors, National Association of Realtors, Federal Housing Finance Agency, U.S. Census Bureau, Mortgage Bankers Association and CoreLogic
Fortunately, Indiana’s fundamentals appear to be improving. As of October 2014, the state has added more than 58,000 jobs in the last year, and its unemployment rate has dropped 1.6 percentage points. Indiana had the nation’s sixth-best improvement in median household income in 2013 according to the Current Population Survey, and its per capita income growth has outpaced the U.S. average over the last few years. After an extended period of sluggish population growth, the state had a relatively strong net in-migration of residents in 2013, and its household formation rate last year was on par with pre-recession levels. Finally, mortgage rates did spike in 2013 but they remain very low, and research by the Federal Reserve indicates that lending standards for prime loans may be loosening a bit.
This article examines some of the latest data in order to gauge the state of Indiana’s housing market.
Pace of Home Sales Cools in 2014
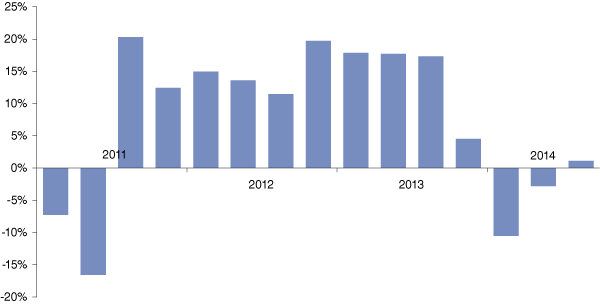
After two years of double-digit increases in the rate of change, existing home sales have taken a step back so far in 2014. Through the first three quarters of the year, existing home sales in the state are down 3.3 percent compared to the same period a year earlier (see Figure 1).
Figure 1: Indiana Home Sales, Year-over-Year Change by Quarter
Source: Indiana Association of Realtors
There are several factors that contribute to this recent decline in home sales. The two largest are likely a rise in mortgage interest rates and a decline in home purchases by investor groups.1 The 30-year conventional mortgage rate jumped a full percentage point between May and December of last year and, while it has declined some this year, it remains higher than it was in 2012 and the first half of 2013. As for investors, several media reports in 2013 showed that they played a role in the home sales rebound in some Indiana markets by buying a large number of single-family homes and converting them into rental properties.2 But as prices climb and the stock of foreclosed homes declines rapidly, investor purchases have likely been on the wane in Indiana this year (as they have been around the country).3 Therefore, this dip in home sales is not necessarily a sign of a weakening market, but more likely signals a stabilizing one.
House Prices on the Rise
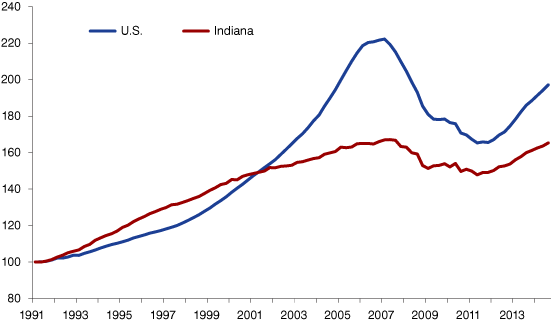
As the market for existing homes in Indiana stabilizes, house prices are on the climb. Through October of 2014, the median sales price for existing homes in Indiana was $126,500—a 3 percent increase over the same period in 2013. The Federal Housing Finance Agency’s House Price Index (HPI) shows strong price gains for the state as well. According to the HPI, Indiana has seen price appreciation for 13 consecutive quarters dating back to mid-2011 and the state’s home prices in the third quarter of 2014 are up 3.3 percent year-over-year.4 This rate of appreciation ranked 37th-fastest among states.
Looking back several years, Indiana house prices declined 12 percent between 2007 and 2011, but the state has since recovered nearly all of the ground it lost during the slump. As of the third quarter of 2014, the HPI for Indiana was only 1 percent lower than its pre-recession peak (see Figure 2). By comparison, the U.S. as a whole is still 11 percent below its peak.
Figure 2: House Price Index, 1991 Q1 to 2014 Q3
Source: Federal Housing Finance Agency, House Price Index (expanded data series, seasonally adjusted)
Foreclosure Rate Hits Lowest Point since 2001
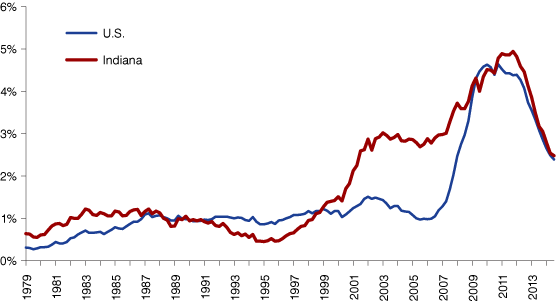
Perhaps the most dramatic sign of the stabilizing market has been the sharp decline in foreclosure rates around the country (see Figure 3). According to the Mortgage Bankers Association, Indiana’s foreclosure rate has been cut in half in less than three years, from 5.0 percent in the fourth quarter of 2011 to 2.5 percent in the third quarter of 2014. This is Indiana’s lowest quarterly foreclosure rate since early 2001. Even with this dramatic decline, Indiana’s foreclosure rate remains slightly above the U.S. average and ranks 18th-highest among states.
Figure 3: Share of Mortgages in Foreclosure, 1979 Q1 to 2014 Q3
Source: National Delinquency Survey, Mortgage Bankers Association
Residential Construction Improving, but Still Weak
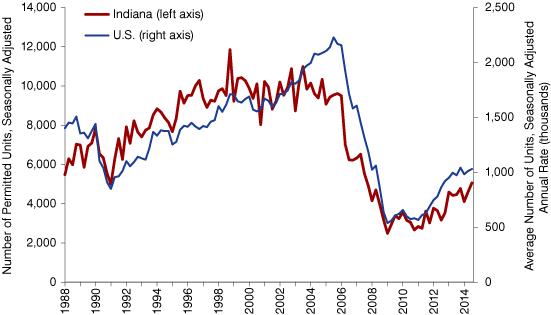
The declining foreclosure rate means that there are fewer distressed properties on the market, which should begin to help boost residential construction. Homebuilding has increased some in Indiana in recent years, but it remains well below historic norms (see Figure 4). In 2013, for instance, the number of building permits for new housing units in Indiana was up 30 percent over 2012, but the total for 2013 was still less than half the number of permits issued during the state’s peak year of 1999.
Figure 4: Residential Building Permits, 1988 Q1 to 2014 Q3
Source: Federal Reserve Bank of St. Louis and U.S. Census Bureau, retrieved from FRED, Federal Reserve Bank of St. Louis
Growth in the number of new units has slowed down. Through September 2014, the number of units is up just 4.5 percent over the same period in 2013.
Demographic Drivers on the Upswing
For residential construction to rebound in a big way, Indiana will need to see stronger migration to the state and a sustained improvement in its household formation rate. Thankfully, these demographic drivers of housing demand are on the rise. Indiana added an estimated 33,100 residents between mid-2012 and mid-2013, up from an increase of 21,400 the year before. This level of change is still lower than the state should expect, but it stops a slide of six consecutive years of decline in Indiana’s population growth rate.
What’s more encouraging for the housing market, and the state in general, is that growth occurred in all adult age groups. The young adult group (ages 25 to 44) added an estimated 6,300 residents in 2013, which is the first time in at least 13 years that this group grew in Indiana. The state’s population between the ages of 45 and 64 grew by a modest 200 residents in 2013 after declining 4,500 the year before. Growth in these age groups is important because they typically drive net gains in household formation and home purchases.
The primary cause of Indiana’s improved population growth was a rebound in migration last year. According to Census Bureau estimates, after three years in which the state had an average annual net out-migration of roughly 2,000 residents, the state posted a net inflow of 8,200 residents in 2013. Movement within the state is also up, particularly among homeowners. Data from the American Community Survey (ACS) show that the share of Hoosier homeowners who reported moving within the state over the previous year increased from 5.3 percent in 2012 to 6.1 percent in 2013. This was Indiana’s highest rate of homeowner movement within the state since 2008.
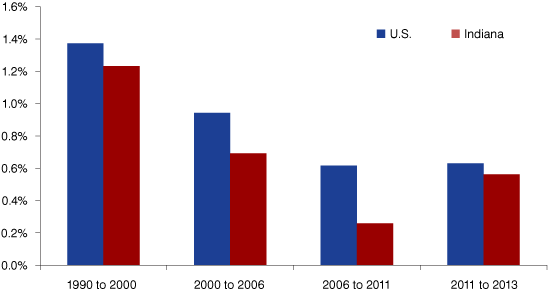
As one might expect, improved migration to the state is helping to boost Indiana’s household formation rate. As Figure 5 shows, after a period of very anemic household growth between 2006 and 2011, the state’s average household formation rate for the last two years is nearly back to the pre-recession level seen in the early and mid-2000s. Stated in raw numbers: Indiana added roughly the same number of households in the last two years (31,300) as it did over the five years between 2006 and 2011 (31,800).
Figure 5: Average Annual Household Formation Rates
Source: U.S. Census Bureau, Decennial Census and American Community Survey
Indiana’s household formation rates could improve even more once the number of households “doubling up” begins to subside. That is, due to the variety of negative effects associated with the housing crash and Great Recession, many adults were forced to reside with family or friends. As a result, Indiana’s headship rate (i.e., the number of households divided by the population age 15 or older), has been on the decline, particularly among young adults. In 2007, for instance, approximately 50 percent of Hoosiers between the age of 25 and 34 were the head of their own household, but the headship rate for that same age group has dropped to 46 percent in 2013. Comparing those same years, age-specific headship rates are down for each age group with the exception of residents age 65 or older. Therefore, there is a sizable pool of potentially untapped housing demand in the state that could enter the market as the economy improves.
Table 2 provides estimates of the shortfall in the number of households in Indiana by age group. The shortfalls were calculated by looking at the differences in the actual number of households in 2013 compared to the number of households we would expect in 2013 if age-specific headship rates were still at the levels seen in 2007. The decline in the headship rate for the 25-to-34 age group referenced earlier translates to more than 31,000 fewer households in the state within this group alone. This number accounts for 41 percent of the state’s total estimated shortfall. All told, Indiana would have had roughly 77,000 more households in 2013 if headship rates were still at 2007 levels.
Table 2: Estimated Shortfall in Number of Indiana Households
| Age Group | Actual Number of Households (thousands) |
Number at 2007 Headship Rates (thousands) |
Difference (thousands) |
|---|---|---|---|
| 15 to 24 | 119.5 | 136.6 | -17 |
| 25 to 34 | 386.7 | 418.2 | -31.5 |
| 35 to 44 | 431.2 | 450.4 | -19.2 |
| 45 to 54 | 504.1 | 518.1 | -14 |
| 55 to 64 | 480.4 | 482.9 | -2.5 |
| 65+ | 576.5 | 568.9 | 7.6 |
| Total | 2,498.4 | 2,575.0 | -76.6 |
Source: U.S. Census Bureau, 2013 American Community Survey
Looking Ahead
2014 has been a period of transition for Indiana’s housing market. In the early years of the housing recovery, the state experienced strong improvements in many key market indicators, even though drivers of housing demand—a strong labor market, migration and favorable lending conditions—were not yet to a point where they could support sustained growth. Instead, these improvements were spurred by a variety of short-term factors, including historically low mortgage rates, a large inventory of distressed properties, bargain prices and bulk purchases by investors.
In 2014, however, the influence of these factors has been on the decline, and the data show it. Gains in residential construction and house prices have moderated so far in 2014 and existing home sales have declined a bit. These developments would be a cause for greater concern if it weren’t for the fact that the foundations of a healthier market are taking shape. Measures of employment growth, unemployment, net migration and household formation have all moved firmly in the right direction in Indiana, and there are indications that access to mortgage credit is improving nationally. Add in the fact that single-family homes remain very affordable in Indiana (see Figure 6), and the state’s housing markets are clearly on more solid footing in 2014.
Figure 6: Mortgage Interest Rates and Indiana Housing Affordability Index, January 1979 to June 2014
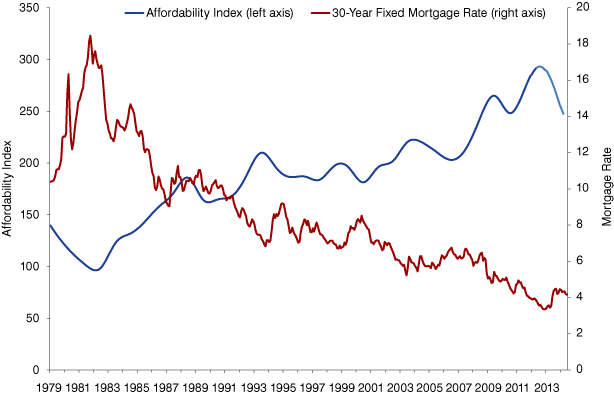
Note: An index value of 100 means that a state’s median household income is exactly enough to qualify for a mortgage on a median-priced home. Values above 100 indicate that the median income is more than enough to qualify. Indiana’s index value was 248 in June 2014, meaning that the state’s median household income was 248 percent of the income needed for a mortgage on a median-priced house. Monthly affordability values are interpolated from annual data. The 2014 index values are a forecast.
Source: Freddie Mac and Moody’s Economy.com
While we would have all liked to see double-digit increases in the rate of home sales and construction continue for a while longer, that level of growth can’t be sustained for long. What the state needs most is to shore up the economic and demographic foundations of a strong housing market to allow for steady growth. In the last 12 to 18 months, Indiana has come a couple of steps closer to reaching that goal.
Notes
- John Krainer, “The Slowdown in Existing Home Sales,” Federal Reserve Bank of San Francisco, May 2014, www.frbsf.org/economic-research/publications/economic-letter/2014/may/existing-home-sales-slowdown/.
- Jeff Swiatek, “Indianapolis Official Wary of Investor Groups Snapping Up Homes,” Indystar.com, September 4, 2013.
- “Q2 2014 U.S. Institutional Investor and Cash Sales Report,” RealtyTrac, August 2014, www.realtytrac.com/content/foreclosure-market-report/q2-2014-us-institutional-investor-and-cash-sales-report-8126.
- An HPI like this one from FHFA is conceptually different from the median sales price indicator discussed earlier. Comparing the median sales price from one period to another can be misleading since the median price is influenced by the mix of homes sold in each period. The HPI is a repeat-sales index, meaning that it measures the changes in sales price when a given property is sold multiple times. This approach removes a good deal of the comparability problems inherent in the median sales price.
