Fast Facts about Indiana's Top 10 Export Markets
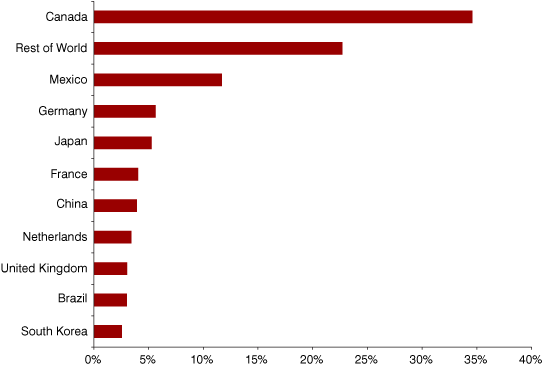
Exports play an important role in the Hoosier economy. While Indiana’s GDP ranks 16th in the country, its dependency on exports ranks 12th. This article highlights the state’s top 10 export markets (see Figure 1). These 10 nations accounted for approximately 77 percent of Indiana’s exports in 2013.
Figure 1: Indiana’s Leading Export Destinations, 2013

Source: WISER Trade
Indiana’s Export Environment
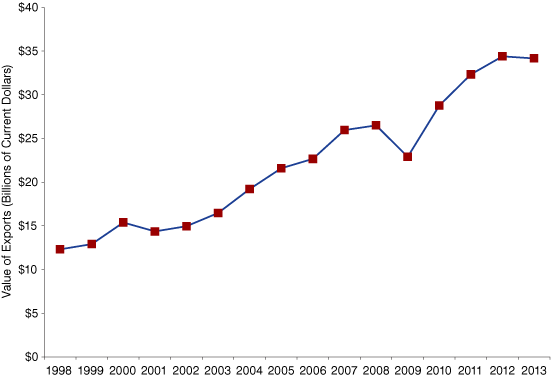
Indiana’s export value has nearly tripled since 1998, from $12.3 billion to $34.2 billion in 2013 (see Figure 2).
Figure 2: Indiana Exports, 1998 to 2013

Source: WISER Trade
Indiana exports recovered quickly from the adverse effects of the Great Recession, but the economic turmoil of the eurozone countries and slow recovery worldwide was finally felt by Indiana export industries in 2013. While exports from both the United States and the Midwestern states grew by 2.2 and 1.2 percent, respectively, Indiana’s exports decreased by 0.7 percent from 2012 to 2013.
Top 10 Export Destinations
Table 1 summarizes Indiana’s exports to the top 10 country destinations in 2013, presenting the current dollar value of exports and the growth in exports over one, five and 10 years.
Table 1: Indiana’s Top Export Destinations—Value and Average Annual Rate of Change, 2003 to 2013
| Export Destination | Value of Exports (Millions of Current Dollars) |
Average Annual Rate of Change | |||
|---|---|---|---|---|---|
| 2012 | 2013 | 2012-2013 | 2008-2013 | 2003-2013 | |
| World Total | 34,399 | 34,162 | -0.7% | 5.1% | 7.3% |
| Canada | 11,900 | 11,816 | -0.7% | 2.2% | 4.5% |
| Mexico | 3,907 | 4,001 | 2.4% | 12.8% | 6.4% |
| Germany | 2,156 | 1,928 | -10.6% | 8.3% | 12.5% |
| Japan | 1,752 | 1,805 | 3.0% | 14.7% | 10.5% |
| France | 1,767 | 1,387 | -21.5% | -0.5% | 4.1% |
| China | 1,309 | 1,346 | 2.8% | 7.4% | 17.5% |
| Netherlands | 788 | 1,175 | 49.0% | 17.9% | 14.0% |
| United Kingdom | 1,199 | 1,038 | -13.4% | -12.9% | -1.5% |
| Brazil | 818 | 1,033 | 26.3% | 9.7% | 13.2% |
| South Korea | 788 | 874 | 11.0% | 17.1% | 13.2% |
Source: WISER Trade
Canada captured 34.6 percent of the state’s exports in 2013 and continues to be the largest market for both the U.S. and for Indiana. Indiana exports to Canada declined slightly (-0.7 percent) from 2012 to 2013 to $11.8 billion. The top three industries are vehicles and parts; industrial machinery; and iron, steel and related products.
Ranking second, Mexico accounted for 11.7 percent of Indiana’s exports in 2013. Indiana exports to Mexico grew by 2.4 percent from 2012 to 2013 to reach $4 billion. The top three industries are industrial machinery; vehicles and parts; and electrical machinery.
Germany emerged as the third top destination for Hoosier goods in 2009 and by 2013 accounted for 5.6 percent of all Indiana exports. Indiana exports to Germany declined 10.6 percent from 2012 to 2013 to $1.9 billion. The top three industries are pharmaceutical products; optical and medical instruments; and miscellaneous chemical products.
Export Trends
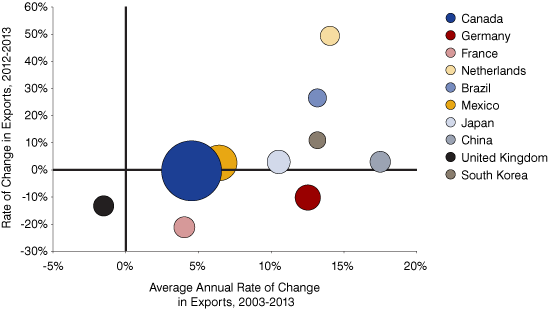
Figure 3 graphically depicts how recent export performance compares with export trends from the last decade. The graph also shows how Canada dominates Indiana’s export portfolio. With the exception of the Netherlands and Brazil, export growth (or export shrinkage for several countries) has not kept pace with the average over the last 10 years. Most of the countries for which Indiana exports have been declining—the United Kingdom, France and Germany, for example—have been experiencing overall lackluster economic performance.
Figure 3: Export Trends for Indiana’s Top 10 Destinations, 2003 to 2013

Note: Bubble size indicates export value in 2013.
Source: WISER Trade
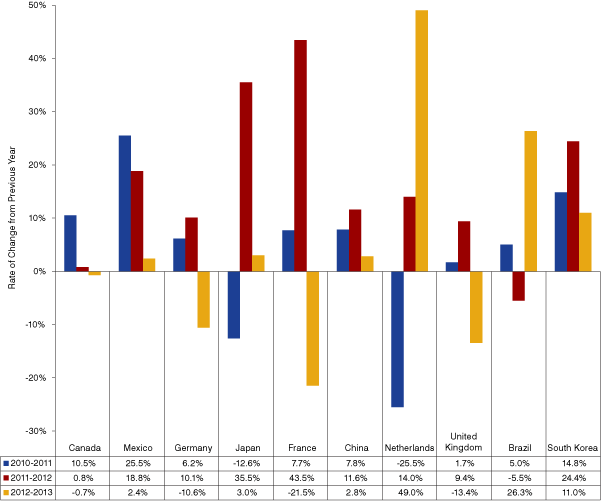
It is worth keeping in mind that countries can experience dramatic swings in Indiana exports from year to year, and the top 10 are no exception. Figure 4 compares the annual change in exports to these export partners for three successive years. From 2010 to 2011, Indiana exports to Japan and the Netherlands shrunk. In the case of Japan, exports surged the next year. In the case of the Netherlands, exports popped in 2013. Only China, South Korea and Mexico have been consistently growing from year to year and even then, not always robustly.
Figure 4: Annual Change in Exports for Indiana's Top 10 Export Destinations, 2010 to 2013

Source: WISER Trade
Looking ahead to the coming year, Table 2 presents the Organization for Economic Cooperation and Development’s (OECD) economic growth forecasts for Indiana’s leading export destinations. It projects lethargic growth by the eurozone countries as a whole, though Germany and France will likely outperform their neighbors. The top three countries with expected growth in 2015 include China (7.3 percent), South Korea (4.2 percent) and Mexico (4.1 percent).
Table 2: Percent Change in Real GDP from Previous Year, 2012 to 2015
| Nation | Actual | Forecast | ||
|---|---|---|---|---|
| 2012 | 2013 | 2014 | 2015 | |
| China | 7.7 | 7.7 | 7.4 | 7.3 |
| South Korea | 2.3 | 3.0 | 4.0 | 4.2 |
| Brazil | 1.0 | 2.3 | 1.8 | 2.2 |
| Canada | 1.7 | 2.0 | 2.5 | 2.7 |
| United States | 2.8 | 1.9 | 2.6 | 3.5 |
| United Kingdom | 0.3 | 1.7 | 3.2 | 2.7 |
| Japan | 1.4 | 1.5 | 1.2 | 1.2 |
| Mexico | 3.7 | 1.3 | 3.4 | 4.1 |
| Germany | 0.9 | 0.5 | 1.9 | 2.1 |
| France | 0.0 | 0.3 | 0.9 | 1.5 |
| Netherlands | -1.3 | -0.8 | 1.0 | 1.3 |
Note: This table is sorted by the actual 2013 growth rate.
Source: Organization for Economic Cooperation and Development
Summary
While Indiana companies export to 115 countries, the top 10 make up 77 percent of all exports. The lethargic economic growth that is expected in the eurozone over the next couple of years is a potential threat to the continued expansion of Indiana exports. On the other hand, the dominance of the Canadian and Mexican markets, together with the potential for expanding exports to some of the emerging economies, may serve as a counterbalance to tepid demand for Indiana exports in Europe.
For more detailed information regarding the export activity of goods and agricultural products produced in Indiana and sold internationally, see the latest “Global Positioning” report at www.ibrc.indiana.edu/studies/globalpositioning2014.pdf.
