Income Inequality Here and There
Income inequality is gaining increased attention in public forums worldwide as an issue of major concern. Arguing for a hike in the minimum wage, President Obama has called income inequality a bigger threat to the U.S. economy than the budget deficit.
The Global Risks report from the 2014 World Economic Forum in Davos, Switzerland, rated income disparity as the most likely global economic risk over the next 10 years, observing that the widening gap between rich and poor has a squeezing effect on the middle classes in developed economies.
Globally, income inequality varies widely. Regions with more evenly balanced distributions of income include Canada, most of Europe, Australia and Kazakhstan. Places with very high levels of income inequality include Bolivia, Colombia, the Central African Republic and much of southern Africa. U.S. income disparity falls in the middle of the worldwide range.1
The extent of income inequality is commonly measured by the Gini index, for which a value of 0 indicates perfect equality (everyone has the same income) and a value of 1 indicates perfect inequality (one person has all the income and everyone else has none). Thus, the higher the Gini value, the greater the income disparity between rich and poor. The index can also be used at the level of households or families. A recent Census Bureau report on U.S. household income inequality calculated the Gini index to be 0.467, which is 18 percent higher than in 1967.2
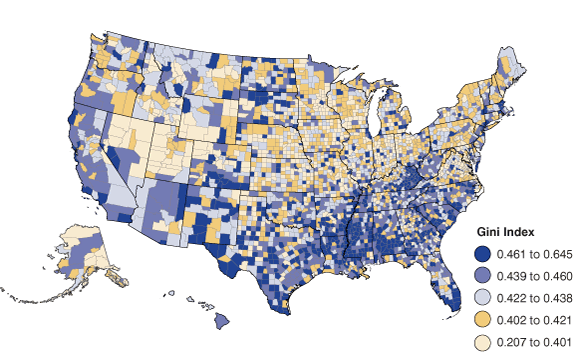
Within the United States, we observe wide variation across counties in income inequality. As shown in Figure 1, greater inequalities are found throughout much of the southern portion of the nation, while lower inequalities are observed commonly in much of the Midwest, Great Plains and central Rocky Mountain regions.
Figure 1: Gini Index for U.S. Counties, 2010

Source: U.S. Census Bureau American Community Survey five-year estimates
Even within a given state, the Gini index can vary widely. In general, the more unequal counties tend to be more urban, with large populations. One-third of Americans live in counties that rank among the top 20 percent on income inequality (i.e., they have high Gini values). The nation’s largest cities tend to have higher concentrations of company headquarters and the kinds of jobs—such as engineering, R&D and finance—that command higher incomes.
At the same time, however, several of the nation’s counties with high income inequality are rural, low-population places. In such places, it is easy for a small number of households with high incomes (e.g., owners of large farms or mining operations) to skew the Gini coefficients when most residents have low incomes.
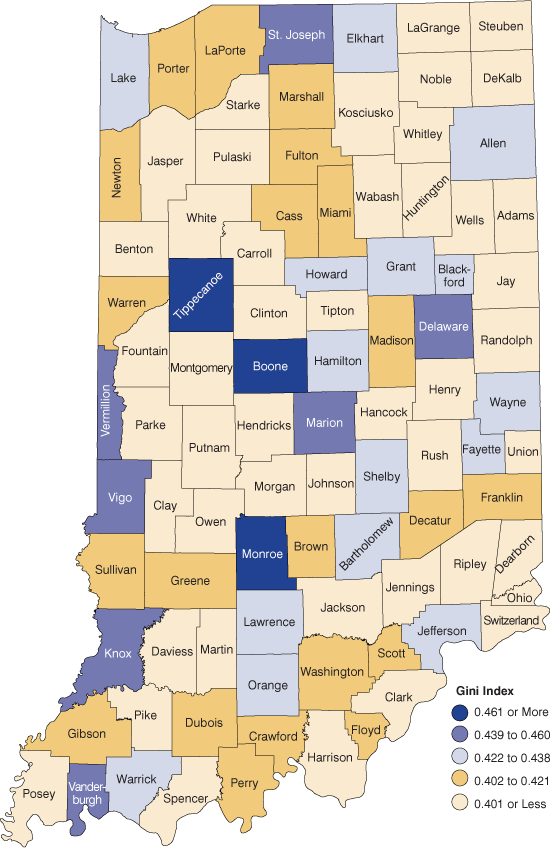
Figure 2 takes a closer look at variation in income equality across Indiana’s 92 counties. Only Boone, Monroe and Tippecanoe counties are in the nation’s top-fifth for income inequality. The latter two’s large universities lead to many lower-income households, while these communities also are home to many well-paid professionals.
Figure 2: Gini Index across Indiana Counties, 2010

Source: U.S. Census Bureau American Community Survey five-year estimates
The second-highest inequality quintile of Indiana counties includes St. Joseph, Delaware and Vigo counties, all home to sizable universities. This group also includes Marion County, whose population includes many lower-income households (in addition to the IUPUI population) as well as many corporate executives and other wealthy households. Vanderburgh County is in this quintile, with a mix of professional and business households, university students and workers, and a range of other sorts of households. Two more-rural counties, Knox and Vermillion, round out the second-highest group for income inequality.
Indiana’s most even distributions of household incomes are found in a wide range of counties. Many are largely rural, but several of the “donut” counties surrounding Indianapolis are also in this group.
Income inequality is the result of many different factors, as these comparisons suggest. On the whole, Indiana is among the nation’s more equitable states with respect to distribution of incomes. Given its current prominence in political and social discourse, income inequality is a subject worth keeping an eye on.
Notes
- See “The Great Divide: Global Income Inequality and Its Cost,” Global Post, www.globalpost.com/special-reports/global-income-inequality-great-divide-globalpost.
- Adam Bee, “Household Income Inequality within U.S. Counties: 2006-2010,” American Community Survey Brief (ACSBR/10-18), February 2012, https://www.census.gov/library/publications/2012/acs/acsbr10-18.html.
