What Can IRS Data Tell Us about Income in Indiana?
While getting up and going to work each day is the predominant source of income for many Hoosiers, recently released data (for tax year 2011) from the Internal Revenue Service (IRS) shed light on some other income streams, such as interest earnings and pensions.
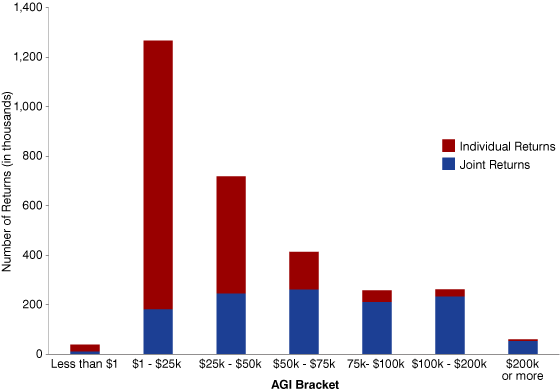
More than 3 million returns were filed statewide, with 40 percent of those being joint returns. Figure 1 shows the number of returns in each adjusted gross income (AGI) bracket.Figure 1: Indiana Tax Returns by Adjusted Gross Income

Source: IBRC, using IRS data
Wages and Investments
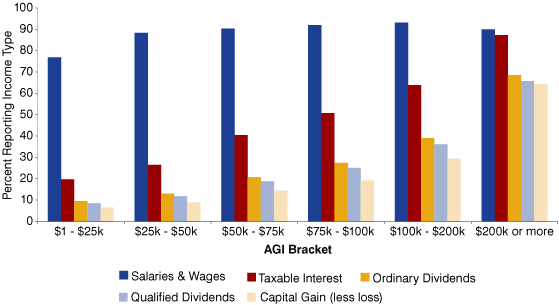
Figure 2 shows that the number of returns reporting salaries and wages varied from 77 percent for Hoosiers with an AGI less than $25,000 to a high of 93 percent for those with an AGI between $100,000 and $200,000.
Figure 2: Income Type Reported in Indiana by Adjusted Gross Income

Source: IBRC, using IRS data
As AGI increased, so did the likelihood of reporting taxable interest, dividends and capital gains. For example, while only 20 percent of Hoosiers with an AGI less than $25,000 reported taxable interest and only 7 percent reported capital gains, those numbers increased to 87 percent and 64 percent, respectively, for those with an AGI of $200,000 or more.
Table 1 shows how the average amount contributed by each income type varied as AGI increased.
Table 1: Indiana’s Average Income by Type and Adjusted Gross Income Bracket
| Income Type | $1 - $25,000 | $25,000 - $50,000 | $50,000 - $75,000 | 75,000- $100,000 | $100,000 - $200,000 | $200,000 or more |
|---|---|---|---|---|---|---|
| Salaries and Wages | $11,088 | $32,732 | $54,221 | $75,157 | $110,773 | $254,302 |
| Taxable Interest | $905 | $1,065 | $1,130 | $1,166 | $1,538 | $8,520 |
| Ordinary Dividends | $1,480 | $2,112 | $2,547 | $2,772 | $4,032 | $22,205 |
| Qualified Dividends | $969 | $1,479 | $1,849 | $2,110 | $3,185 | $17,534 |
| Capital Gain (less loss) | -$152 | $840 | $1,430 | $2,480 | $4,954 | $71,251 |
Note: Averages are calculated based on the number reporting that type of income within each AGI bracket.
Source: IBRC, using IRS data
Retirement Income
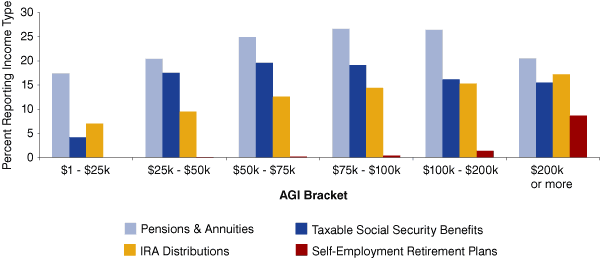
Pensions and annuities are an important income stream for Hoosier retirees across all income brackets (see Figure 3). In all, more than 620,000 Indiana tax returns reported this type of income.
Figure 3: Sources of Retirement Income in Indiana by Adjusted Gross Income

Source: IBRC, using IRS data
Meanwhile, almost 361,000 reported taxable Social Security benefits (whether or not Social Security benefits are taxable depends on one’s total income and marital status, so this does not capture those with untaxed benefits). About 297,000 reported individual retirement account (IRA) distributions. Only about 12,200 tax returns included self-employment retirement plan distributions.
Table 2 shows that pensions and annuities are the leading source of retirement income (excluding those untaxed Social Security benefits, which are not reported in this data set) across all income brackets up to $200,000. Those in the top income bracket have IRA distributions as the leading source of income.
Table 2: Indiana’s Average Retirement Income by Type and Adjusted Gross Income Bracket
| Income Type | $1 - $25,000 | $25,000 - $50,000 | $50,000 - $75,000 | 75,000- $100,000 | $100,000 - $200,000 | $200,000 or more |
|---|---|---|---|---|---|---|
| Pensions and Annuities | $8,165 | $15,325 | $19,225 | $22,578 | $28,343 | $41,853 |
| Taxable Social Security Benefits | $1,642 | $6,203 | $14,414 | $18,957 | $21,078 | $23,729 |
| IRA Distributions | $5,133 | $9,030 | $12,880 | $17,679 | $26,765 | $56,518 |
| Self-Employment Retirement Plans | $4,009 | $6,686 | $7,373 | $9,417 | $14,818 | $29,682 |
Note: Averages are calculated based on the number reporting that type of income within each AGI bracket.
Source: IBRC, using IRS data
Learn More
While you can always visit the IRS website to download the county-level or ZIP Code data nationwide, the Missouri Census Data Center has processed these files and offers enhanced versions of the files (e.g., easy-to-understand variable names and value-added calculations) via their Uexplore tool. Visit http://mcdc.missouri.edu/data/irstaxes/Readme.shtml to learn more about accessing the enhanced files.
