Fast Facts about Foreign Direct Investment in Indiana
Foreign direct investment (FDI) has long played an important role in Indiana’s economy, particularly in the manufacturing sector. Since the Great Recession, FDI investments have rebounded nationally and within Indiana. This article highlights some key facts about this important part of the state’s economy.
Employment
Indiana ranks 14th in the nation in majority-owned U.S. affiliate (MOUSA) employment—that is, employment in a business where the combined ownership of all foreign parents exceeds 50 percent—as of 2010 (the most current year available at the time of writing). Nearly 5.7 million U.S. workers are employed by these enterprises, with 133,600 of these workers in Indiana.
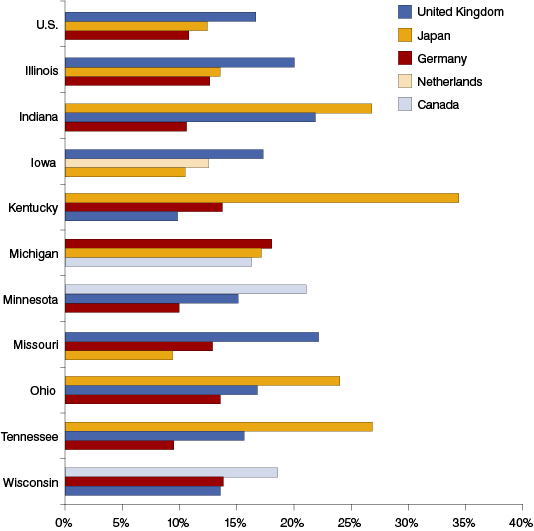
Japan, the United Kingdom and Germany are the largest sources of MOUSA employment in Indiana (see Figure 1). Japan alone accounts for nearly 27 percent of MOUSA employment in the state. Nationally, the same three countries are at the top, but Japan comprises a much lower 12 percent of the total.
Figure 1: Top Three Sources of MOUSA Employment for Midwestern States, 2010

Source: IBRC, using Bureau of Economic Analysis data
Roughly 5.7 percent of Indiana private employment is in MOUSAs states. In the Midwest, only Kentucky (6.2 percent) exceeds this figure.
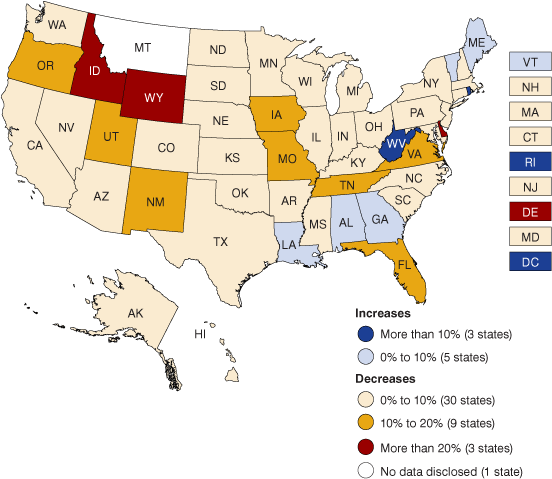
The recovery from the Great Recession in terms of FDI-related employment has been very different across states (see Figure 2). Between 2008 and 2010, the majority of states (including all of the Midwestern states) had MOUSA job losses. However, Indiana had the smallest job decline in the Midwest at 4.8 percent.
Figure 2: Percent Change in MOUSA Employment, 2008 to 2010

Source: IBRC, using Bureau of Economic Analysis data
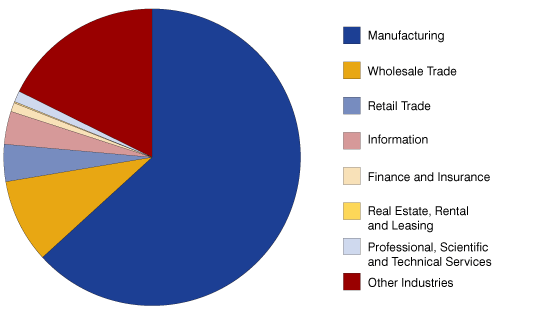
The manufacturing industry captures the largest share of MOUSA employment nationally at 37.7 percent. Indiana exceeds this, with manufacturing accounting for 63.2 percent of MOUSA employment (see Figure 3). These 84,400 manufacturing jobs equate to 18.9 percent of Indiana’s total manufacturing employment (and account for 3.6 percent of the state’s private employment).
Figure 3: Indiana's Share of MOUSA Employment by Industry, 2010

Source: IBRC, using Bureau of Economic Analysis data
Recent FDI Announcements
Between 2010 and 2012, there were 4,347 FDI announcements for the country as a whole, valued at $170.9 billion with 365,270 expected jobs.1 Indiana had 143 FDI announcements valued at $4.7 billion.2 These investments are projected to create a total of 12,400 jobs, or about 4,100 new jobs per year.
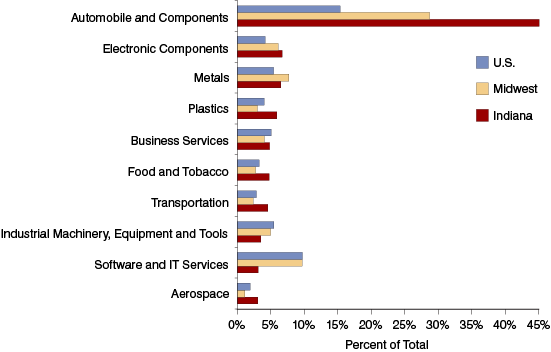
The automobile and components industries captured the largest share of Indiana’s expected FDI jobs at 5,600 new positions, 45.1 percent of the total anticipated FDI jobs announced between 2010 and 2012 (see Figure 4). This averages over 1,850 new jobs in manufacturing per year.
Figure 4: Top 10 Industries for FDI Project Announcement Employment, 2010 to 2012

Source: IBRC, using fDi Markets data
Manufacturing remained the most popular business activity for foreign investment in Indiana, comprising 74 percent of all expected jobs compared to 44.8 percent nationally. (Business activity classifies FDI projects based on the primary task undertaken at a facility rather than on the type of product or service a company produces. An automotive industry FDI announcement, for instance, could be primarily involved in one of several activities, such as manufacturing, research and development, servicing a customer service center, or a company headquarters.)
Behind manufacturing, headquarters activities captured the second-largest share of FDI employment in Indiana, accounting for 9 percent of total job announcements over the three-year period.
Learn More
For a more in-depth look at FDI in the state, as well as the global FDI environment, see Capturing the Flag 2013: Foreign Direct Investment in Indiana for the full analysis.
Notes
- Data in this section come from investment tracking service, fDi Markets (www.fdimarkets.com). fDi Markets “counts” the FDI project the year it is announced with the understanding that it may take years before the investment is fully realized, if the project is realized at all. Additionally, an important difference compared to BEA data is that fDi Markets collects data on greenfield and expansion projects only and not mergers and acquisitions. One must exercise some caution when using and interpreting these data because fDi Markets uploads the data as announcements are made (thus enhancing its timeliness), but subsequent announcements or adjustments to that particular announcement may not be reflected in the database. Additionally, if investment or employment values are not announced explicitly, fDi Markets estimates these values with varying degrees of accuracy. Despite these inherent shortcomings, fDi Markets is our best source for current FDI activity.
- To provide a more accurate view of Indiana’s FDI announcements, the IBRC adjusted the fDi data for Indiana after attempting to double-check each announcement to confirm or deny the fDi-reported employment and capital figures reported for the state.
