Vehicles and Pharmaceuticals Lead Indiana's Exports
Exports play an important role in the Hoosier economy. Relatively speaking, exports are more important to Indiana than other states. While Indiana’s economic output, or gross domestic product (GDP), ranks 16th in the country, its dependency on exports ranks 11th. This article highlights the state’s two leading export industries: vehicles and parts and pharmaceuticals.
Table 1 presents the top 10 export industries for Indiana in 2012. These industries constitute 84.3 percent of all exports out of Indiana.
Table 1: Indiana's Top 10 Export Industries, 2002 to 2012
| Industry | Exports (in millions) | Average Annual Growth Rate | |
|---|---|---|---|
| 2012 | 2011-2012 | 2002-2012 | |
| Vehicles and Parts (Excluding Railway) | $7,156 | -7.6% | 5.4% |
| Pharmaceutical Products | $6,040 | 23.8% | 24.0% |
| Industrial Machinery (Including Computers) | $5,536 | 8.9% | 5.4% |
| Optical and Medical Instruments | $2,484 | 7.7% | 10.1% |
| Electric Machinery | $2,109 | 18.6% | 4.4% |
| Aircraft, Spacecraft and Parts Thereof | $1,318 | 37.0% | 29.8% |
| Iron, Steel and Articles Thereof | $1,289 | -10.7% | 11.3% |
| Plastics and Articles Thereof | $1,225 | 9.3% | 6.8% |
| Organic Chemicals | $1,209 | -17.6% | 3.0% |
| Miscellaneous Chemical Products | $656 | 3.8% | 1.5% |
Note: Industries are defined by the Harmonized System of Commodity Classifications.
Source: WISER Trade
Vehicles and parts retained its perch as Indiana’s largest export industry in 2012, despite a slight decline in export value from the prior year. Pharmaceuticals regained the number two spot from industrial machinery thanks to strong growth in 2012. In fact, if the current trends for the top two industries continue, pharmaceutical products may become the top export in the near future.
Vehicles and Parts
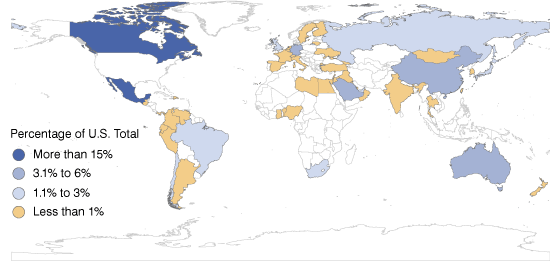
Figure 1 displays the share of 2012 U.S. vehicle and parts exports for destination countries with export purchases greater than $200 million. Canadian purchases of vehicles and parts have slowly rebounded since the downturn in 2009 and have yielded a 3.8 percent average annual growth rate since 2002.
Figure 1: Destinations for U.S. Exports of Vehicles and Parts (Excluding Railway), 2012
Note: Includes countries with export purchases greater than $200 million.
Source: WISER Trade
However, the share of vehicles and parts earmarked for Canada has slowly dwindled from 58 percent in 1999 to 37.8 percent in 2012. Mexico—America’s second-largest trading partner—has seen a slight increase in its share of vehicles and parts, commanding 15.2 percent of U.S. exports in 2012.
Of the top 15 countries that imported vehicle and parts products, nine had double-digit average annual growth rates from 2002 to 2012: China, Saudi Arabia, Australia, United Arab Emirates, Chile, Russia, Brazil, South Africa and Nigeria. Individually, these countries import a relatively small share compared to Canada or Mexico, but collectively they imported 22.3 percent—exceeding Mexico’s share.
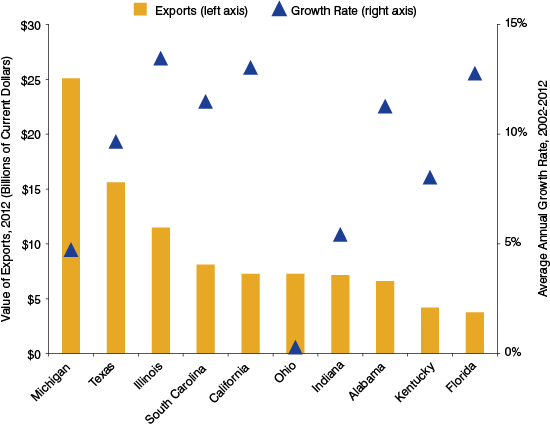
Michigan is the dominant exporter of vehicles and parts, accounting for 18.8 percent of the U.S. total, followed by Texas at 11.7 percent. Michigan has experienced a meager average annual growth rate of 4.3 percent in the past decade, while Texas has experienced a 12.7 percent average annual growth rate since 2002 (see Figure 2). In 2012, Indiana ranked seventh at approximately $7 billion, accounting for 5.4 percent of the total vehicles and parts exports.
Figure 2: Leading States in the Export of Vehicles and Parts (Excluding Railway), 2002 to 2012
Source: WISER Trade
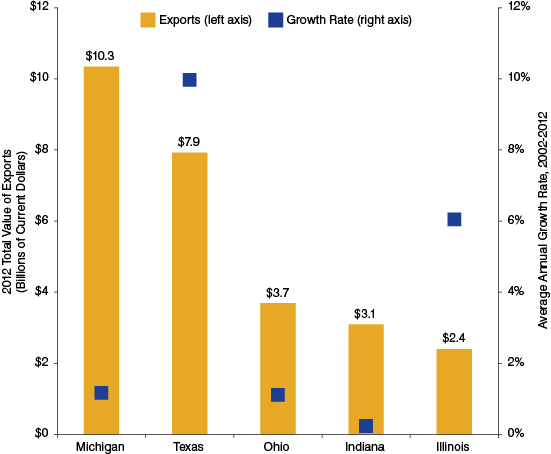
Indiana’s top exported commodity within the broadly defined vehicles and parts industry was motor vehicle parts and accessories. Figure 3 shows the top five exporting states for this commodity. Michigan was the leader in this category in terms of sales volume ($10.3 billion) followed by Texas ($7.9 billion). In the past decade, Michigan has posted languid average annual growth rates relative to Texas. If this trend continues, Texas will rival Michigan for the number one spot. Indiana ranks fourth in total value, slightly trailing Ohio. The top three destinations for Indiana’s motor vehicle parts and accessories exports were Canada, Mexico and China.
Figure 3: Top Five Exporting States of Motor Vehicle Parts and Accessories, 2002 to 2012
Source: WISER Trade
Pharmaceuticals
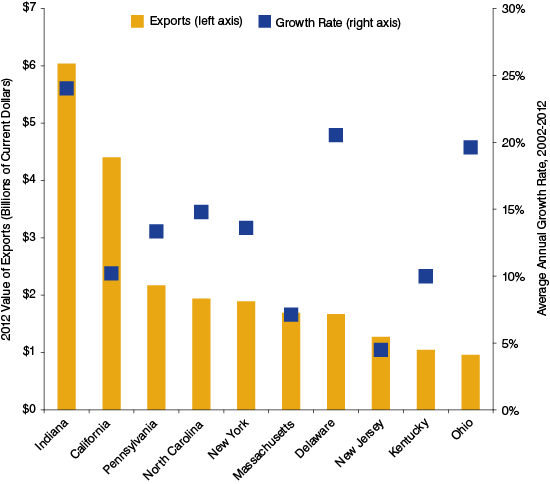
Nationally, pharmaceutical products were the 11th-largest exported commodity; however, in Indiana it’s the second-highest-valued exported commodity. Among all states, Indiana has been the top exporter of pharmaceuticals since 2009. Indiana and California comprised 15.1 percent and 11 percent of the nation’s exports, respectively, and their shares have grown over the years.1 Figure 4 shows Indiana’s 24 percent average annual growth rate surpassing all other top 10 exporting states, explaining its growing share of the nation’s exports in this category.
Figure 4: Leading States in the Export of Pharmaceuticals, 2002 to 2012
Source: WISER Trade
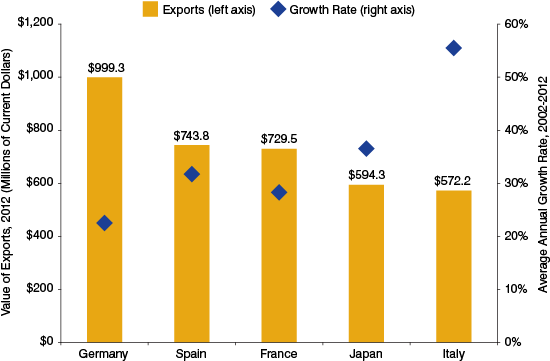
Figure 5 presents the top five export destinations for Indiana’s pharmaceuticals in 2012. Four of the five destination countries were in Europe, an important region to Indiana’s pharmaceutical industry. In 2010, Germany claimed the top spot as an importer of Indiana’s pharmaceutical products—replacing the United Kingdom—and has held onto this position through 2012.
Figure 5: Indiana’s Top Five Export Destinations for Pharmaceutical Products, 2002 to 2012
Source: WISER Trade
Of the six pharmaceutical products exported from Indiana, medicines2 comprise the lion’s share of the export activity (83.7 percent). Indiana is the leading exporter of medicines among states, responsible for 20.4 percent of the national share.3
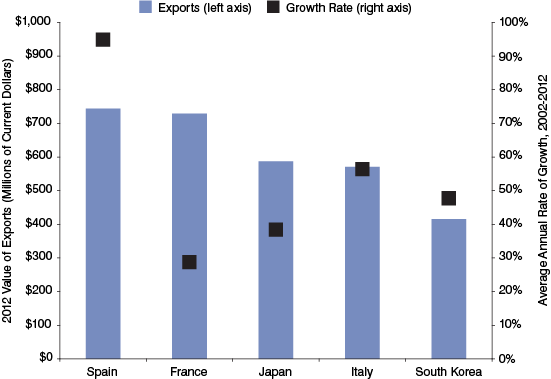
Spain and France are the leading importers of this Hoosier commodity, purchasing 14.7 percent and 14.4 percent, respectively (see Figure 6). Strong double-digit growth has propelled this commodity’s export value. Spain leads the pack on this measure with a 94.8 percent average annual growth rate from 2002 to 2012.
Figure 6: Indiana’s Top Five Destinations for Medicines, 2002 to 2012
Source: WISER Trade
Summary
Indiana’s exports recovered quickly from the adverse effects of the Great Recession, but the economic turmoil of the eurozone countries and slow recovery worldwide inhibited acceleration in exports in 2012. That said, Indiana’s exports grew at a higher rate (6.5 percent) than both the United States (4.5 percent) and the Midwest (6 percent) over the year. While vehicles and parts experienced a 7.6 percent decline between 2011 and 2012, pharmaceutical exports grew by 23.8 percent over the year.
The sluggish growth in the eurozone over the next couple of years is a potential threat to the continued growth of Indiana exports—particularly in the life sciences sector, which includes pharmaceuticals. However, the dominance of the Canadian and Mexican markets for other leading industries—together with the possible potential for expanding exports to emerging economies—may diminish the negative effects of sluggish European growth on Indiana’s exports overall.
For a more detailed exploration of the state’s exports, view “Global Positioning: State of Indiana’s Export Activity, 2013” at www.ibrc.indiana.edu/studies/globalpositioning2013.pdf.
Notes
- Puerto Rico contributes 22.1 percent of the nation’s pharmaceutical exports, but since it’s not a state, its total is excluded from state ranking calculations.
- Medicaments is the official title of the commodity, but for ease of understanding the term medicines is used in this report.
- Puerto Rico accounted for 31.3 percent of this category’s total, but was excluded since it is not a state.
