Indiana INdicators: A New Community Health Dashboard
In Indiana, 20.3 percent of adults between 18 and 64 years old lack health insurance, better than the nation’s rate of 21.5 percent. Among Hoosier adults (age 18 and older), 30.8 percent are considered obese, compared to 27.8 percent nationally. The rate of heart disease mortality has dropped to 194.1 in Indiana, but is still higher than the national rate of 180.1 (rates are per 100,000 population).
What does all this mean? Put it together with nearly 100 other indicators now available on the recently released Indiana INdicators website (www.IndianaINdicators.org) and you can get a good idea of Indiana’s overall health and quality of life. Not only does the site tell where we are now, but it also shows us goals for the future.
The Indiana State Department of Health (ISDH), the Indiana Hospital Association (IHA), the Indiana Business Research Center (IBRC) and the Indiana University Public Policy Institute partnered to provide this exciting new resource, funded through a grant from the Centers for Disease Control and Prevention.
Indiana Health Dashboard
Dashboards have become a popular way to hone in on what’s critical. The dashboard indicators used on this site were deemed of critical importance to Indiana and our communities by professionals at the Indiana State Department of Health and the Indiana Hospital Association.
There are two geographic levels to the dashboard—statewide and community level (county). The demographic dashboard compares a user-selected county to the state, while the health dashboard provides a snapshot of important health trends around the state. Where goals (or targets) are available, those are shown with the indicator as a way to determine how far we have to go to make progress or achieve an optimum target.
The site can also demonstrate where communities are succeeding in improving health. Looking at the prenatal smoking indicator, we can see that Adams County has reduced the percentage of mothers smoking during pregnancy to 9.7 percent, lower than the state’s percentage of 17.1 percent (see Figure 1).
Figure 1: Prenatal Smoking Indicator for Adams County, 2010
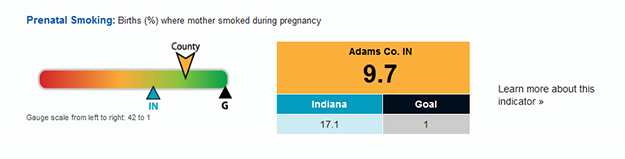
Source: Indiana INdicators, using Indiana State Department of Health data
There will be times you’ll want more information about a specific indicator and you can click on the “Learn more about this indicator” link to view the source time period, and why the indicator is important and useful. It also provides links to promising practices and news links specific to the topic.
If you like the dashboard indicators but are itching for more data, the key indicators section offers tables and graphs of the indicators and allows you to toggle between geographies. Among the Midwestern states, Indiana ranked fourth for the longest average travel time to work (see Table 1).
Table 1: Travel Time to Work (Average Aggregate Minutes), 2011
| Rank (Longest to Shortest Time) | State | Time in Minutes |
|---|---|---|
| 1 | Illinois | 28.1 |
| 2 | Michigan | 23.9 |
| 3 | Missouri | 23.3 |
| 4 | Indiana | 23.1 |
| 5 | Ohio | 22.9 |
| 6 | Kentucky | 22.6 |
| 7 | Minnesota | 22.6 |
| 8 | Wisconsin | 21.5 |
Source: Indiana INdicators, using U.S. Census Bureau American Community Survey five-year estimates
Maps
If you want something visual to compare your county to others in Indiana on numerous measures, an interactive map does just that. Compare demographics, educational attainment, health, housing, income, poverty and transportation data. You can also overlay the map with point features, including hospitals, accredited cancer programs, liquor stores, grocery stores and farmers markets just to name a few.
According to ISDH, lung cancer is the leading cause of cancer deaths in Indiana. Figure 2 shows lung cancer deaths per 100,000 with an overlay of accredited cancer programs. With this view, it’s easy to see the regions where lung cancer poses the greatest burden.
Figure 2: Lung Cancer Deaths per 100,000 Population, 2009
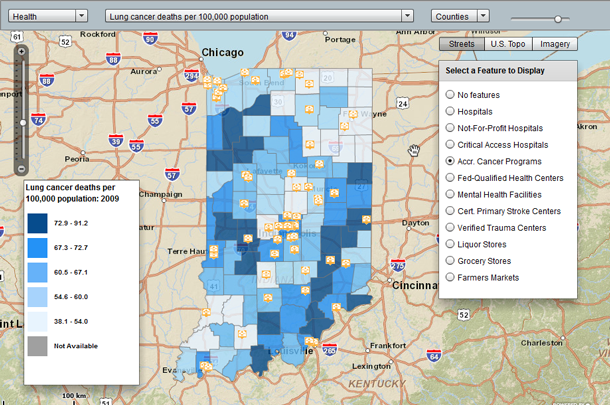
Source: Indiana INdicators, using Indiana State Cancer Registry data
Demographic Profiles
Demographic profiles (found in the “Data Central” section) offer a regional view of the data. It’s easy to see how your county, health district or region compares to Indiana when looking at these profiles. In addition to population, housing and income data that is typical in a data profile, these profiles also include public transportation data, injury prevention statistics and cause of death data.
Beyond Indiana
If you want to compare Indiana areas more broadly, region comparisons allow you to compare multiple geographies across the entire United States side by side on several topics ranging from population to industry composition.
For example, of the metros in Indiana, Michigan and Ohio, Indiana had three of the four metros with at least one-fifth of total jobs in the manufacturing industry. The Holland-Grand Haven, MI metro was the only non-Indiana metro to meet that criterion (see Figure 3). Ohio had no metros in the top 10 manufacturing-intense metros in these three states.
Figure 3: Manufacturing as a Percent of All Jobs by Place of Work for Selected Metros, 2011
Source: IBRC, using Bureau of Labor Statistics data
In Conclusion
Two significant events have occurred to focus considerable attention on health care and hospitals. The first is the Affordable Care Act and the other is the new regulation for nonprofit hospitals to essentially prove their need in their communities. Our ability to measure the effects of these events on the health and well-being of Hoosiers will be met, in part, by this new and unique website, Indiana INdicators. We encourage you to visit the site, review the indicators, play with the mapping tool and provide feedback.
Molly Manns
Associate Editor, Indiana Business Research Center, Indiana University Kelley School of Business
The INdicators website is supported by the Cooperative Agreement Number 3B01DP009019-11S1 from the Centers for Disease Control and Prevention (CDC).