How Long Is That Commute? OnTheMap Sheds Light on Distance from Home to Work
Nearly half of those who work in Indiana live within 10 miles of their job (see Figure 1), while 15 percent commute more than 50 miles each way. OnTheMap, a web-based tool from the Census Bureau showing the work-residence patterns of workers, was upgraded earlier this year and includes several new analytical capabilities. This article highlights the new “distance direction” feature using both statewide data and that for Indiana’s 10 largest cities.
Figure 1: Distance to Primary Job for Indiana Workers, 2010
Note: Distance is calculated from work census block to home census block.
Source: IBRC, using Census Bureau data
More than half of workers in 6 of the 10 largest cities in the state live within 10 miles of their job (see Figure 2). Who has the shortest commutes? Sixty-three percent of workers employed in Evansville and South Bend travel less than 10 miles (see Table 1).
Figure 2: Commuting Distance for Workers in Indiana's 10 Largest Cities, 2010
Note: Cities are sorted by size of workforce.
Source: IBRC, using Census Bureau data
Table 1: Percent of Workforce Living Less than 10 Miles from Job, Indiana's 10 Largest Cities, 2010
| City | Percent of Workforce | Number of Workers |
|---|---|---|
| Evansville | 63% | 54,524 |
| South Bend | 63% | 35,520 |
| Fort Wayne | 58% | 75,807 |
| Muncie | 54% | 17,549 |
| Gary | 53% | 16,443 |
| Bloomington | 51% | 23,102 |
| Indiana | 49% | 1,254,055 |
| Hammond | 49% | 14,356 |
| Carmel | 47% | 24,082 |
| Fishers | 45% | 11,568 |
| Indianapolis | 45% | 221,971 |
Source: IBRC, using Census Bureau data
At the other end of the spectrum, those working in Bloomington had the highest percentage (21 percent) of commutes exceeding 50 miles (see Table 2). Among the 10 largest cities, Bloomington workers also had the highest percentage of those traveling 25 to 50 miles.
Table 2: Percent of Workforce Living More than 50 Miles from Job, Indiana's 10 Largest Cities, 2010
| City | Percent of Workforce | Number of Workers |
|---|---|---|
| Bloomington | 21% | 9,217 |
| Fort Wayne | 18% | 23,833 |
| Muncie | 16% | 5,112 |
| Indianapolis | 15% | 75,108 |
| Indiana | 15% | 375,592 |
| Fishers | 14% | 3,554 |
| Evansville | 14% | 11,911 |
| Carmel | 14% | 6,924 |
| South Bend | 12% | 6,854 |
| Gary | 12% | 3,675 |
| Hammond | 11% | 3,305 |
Source: IBRC, using Census Bureau data
Figure 3 shows the radar charts generated by the OnTheMap application. These charts combine distance and direction into a single visual and illustrate the uniqueness of each city’s commuting structure.
Figure 3: Distance and Direction to Home for Workers in Indiana's 10 Largest Cities, 2010
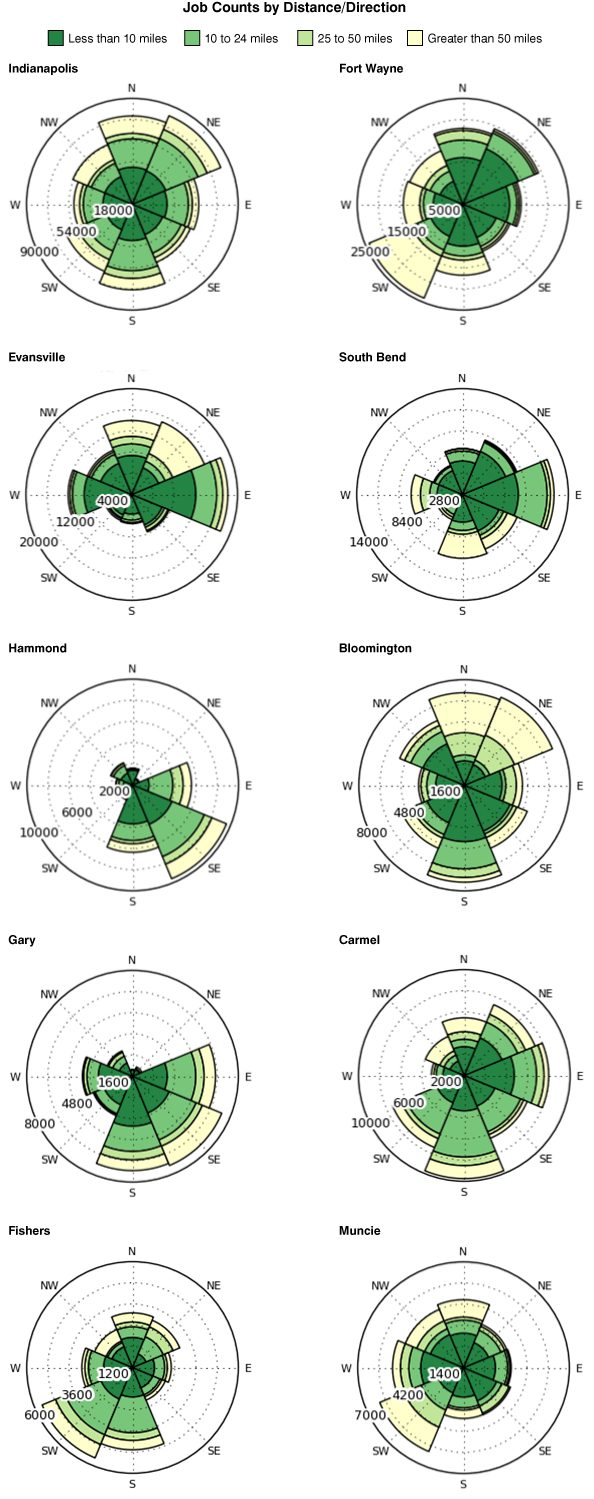
Source: IBRC, using Census Bureau data
OnTheMap, now in its 6th version, includes data for 49 states plus the District of Columbia (data for Massachusetts should be available in the near to medium term). It is worth noting that these data do not currently include the self-employed, military and the informally employed (i.e., those not covered by state unemployment insurance laws).1 Prior users of OnTheMap will notice that the new application is much faster and includes 2010 census blocks and other geographies.
View the analysis guides for a step-by-step approach to using each of the report types available in OnTheMap, or simply go to the website and jump in: http://onthemap.ces.census.gov/.
Notes
- Federal worker data were released in the summer of 2012 and self-employment data are tentatively planned for 2013.
Rachel M. Strange
Geodemographic Analyst, Indiana Business Research Center, Indiana University Kelley School of Business