Indiana's Statistical Areas: An Overview
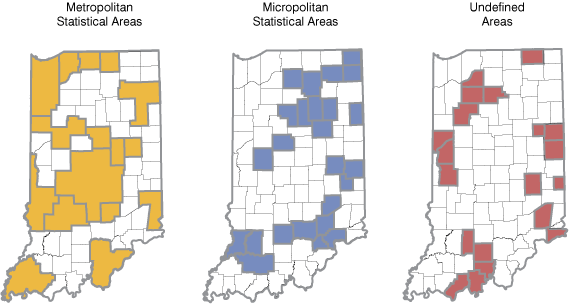
The United States is made up of various statistical areas, including metropolitan statistical areas (metros) and micropolitan statistical areas (micros). In short, metros are areas centered around an urbanized core with a population of at least 50,000; micros are urban clusters with a population between 10,000 and 50,000. Indiana has 16 metros and 25 micros. Of Indiana's 92 counties, 20 counties are not included in either a metro or micro (see Figure 1). Those areas not included in a metro or micro will be referred to as undefined areas for the purposes of this article.
Figure 1: Maps of Indiana's Metros, Micros and Undefined Areas
Source: Indiana Business Research Center
Population
Indiana's metro counties made up 78.5 percent of the state's population in 2011, while micros contained 15.9 percent of Indiana's population, and the undefined counties made up the remaining 5.6 percent of the population.
In 2011, metros were the only areas to experience an overall gain in population, adding nearly 27,000 residents. Indiana's micro population decreased by about 250 people and the undefined area population decreased by about 300 people (see Table 1). Metros as a whole, micros as a whole, and undefined counties as a whole all saw a natural increase in population (more births than deaths) and each group experienced positive net international migration (more people from outside U.S. borders moved into the areas than moved out of the areas). However, all groups saw a negative net domestic migration (more people moved elsewhere in the United States).
Table 1: Change in Population for Indiana's Metros, Micros and Undefined Areas
| Components of Population Change, 2011 | Metros | Micros | Undefined Areas |
|---|---|---|---|
| Net Domestic Migration | -4,490 | -3,331 | -1,238 |
| Net International Migration | 6,305 | 746 | 124 |
| Natural Increase (births minus deaths) | 25,100 | 2,328 | 805 |
| Total Change in Population, 2010-2011 | 26,915 | -257 | -309 |
Source: IBRC, using U.S. Census Bureau data
Indiana's metros have a higher proportion (10.4 percent) of college age students, compared to 9 percent in micros and 7.8 percent in undefined areas. Metros also have a higher proportion of minority populations (see Figure 2).
Figure 2: Percent Distribution of Race in Metros, Micros and Undefined Areas, 2011
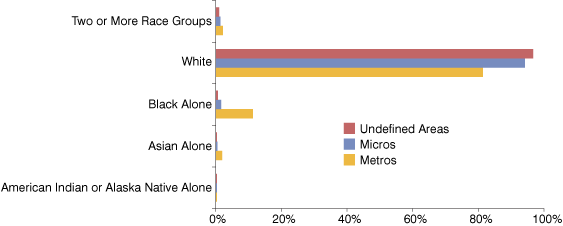
Note: Native Hawaiian and Other Pacific Islander are omitted from the graph since they make up 0 percent of the population in each area.
Source: IBRC, using U.S. Census Bureau data
Households
Micros and undefined areas have a higher proportion of households that are married with children: 20.1 percent of households in micros and 20.9 percent in undefined areas, compared to 19.8 percent in metros. The micros and undefined areas also have a higher proportion of married households without children (see Figure 3). Meanwhile, the proportion of single parents and those living alone is higher in metros than in the more rural areas of the state.
Figure 3: Household Types in Metros, Micros and Undefined Areas, 2011
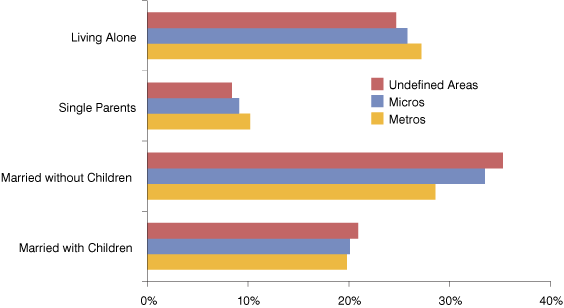
Note: Percentages do not add to 100 because these household types are not inclusive of all households in each area
Source: IBRC, using U.S. Census Bureau data
Income and Poverty
While metros make up 78.5 percent of Indiana's population, they contain 85.7 percent of those receiving welfare (TANF) payments according to the latest data available.1 Micros had 10.9 percent of Indiana's total welfare population and undefined areas had 3.4 percent.
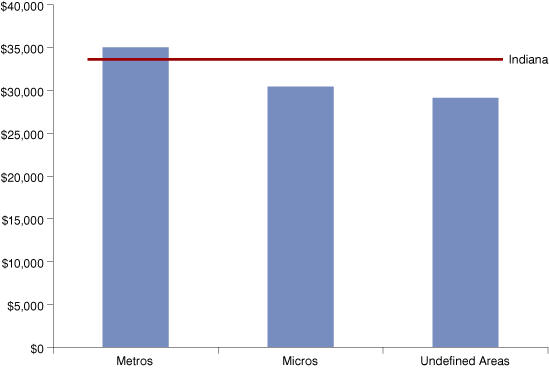
Even though the metros had a proportionately higher percentage of people on welfare, they had a higher per capita personal income in 2010 ($35,050). Micros had an annual per capita income of $30,454, while undefined areas came in at $29,142 (see Figure 4).
Figure 4: Per Capita Personal Income by Area, 2010
Source: IBRC, using U.S. Bureau of Economic Analysis and U.S. Census Bureau data
Labor Force and Employment
More urbanized areas generally indicate more opportunity for work, as can be seen in the unemployment numbers by area (see Table 2). Micros and undefined areas had higher unemployment rates for 2011 than metros and Indiana overall.
Table 2: Unemployment Rates for Indiana's Metros, Micros and Undefined Areas
| Geography | Annual Unemployment Rate, 2011 | March 2012 Unemployment Rate |
|---|---|---|
| Metro Counties | 8.9 | 8.6 |
| Micro Counties | 9.5 | 8.9 |
| Undefined Areas | 9.2 | 8.8 |
| Indiana | 9.0 | 8.6 |
Source: Indiana Department of Workforce Development
Nearly 99 percent of employment in metros was nonfarm employment, compared to 95.7 percent in micros and 92 percent in undefined areas. Therefore, even in "farming counties," the vast majority of employment is not in farming. Manufacturing was the single industry with the highest proportion of workers in 2010 for metros (11.5 percent), micros (20.6 percent) and undefined areas (16.8 percent). The higher proportion of manufacturing in micros and undefined areas could help explain why the unemployment rates are higher in the less urban areas after the Great Recession of 2007-2009 since the manufacturing industry took some hard hits.
Two industries showed major employment differences from metros to other areas of the state: the health care and social services industry as well as the professional and technical services industry. Metros had a considerably higher proportion of workers in these industries than did micros or undefined areas (see Figure 5).
Figure 5: Percent Distribution of Employment Industry, 2010
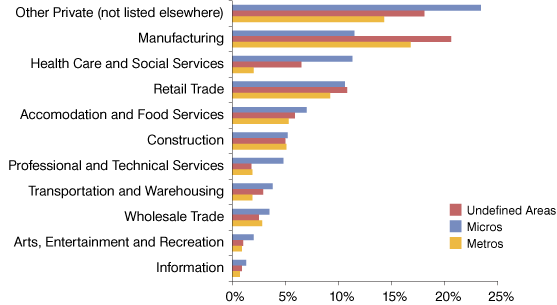
Note: Only industry data for retail trade was fully disclosable in all geographic areas. All other industries had at least one county where industry data are not disclosable by BEA requirements.
Source: IBRC, using Bureau of Economic Analysis data
Summary
The data in this article show what is generally expected to be true. Metros have more people (by definition), higher pay (though not necessarily more buying power), more single parents and those living alone, lower unemployment rates, but more people on welfare. Learn more about individual metros, micros and other counties at STATS Indiana.
Notes
- Welfare data are from 2008 (www.stats.indiana.edu/topic/welfare.asp#welfare). TANF (Temporary Assistance to Needy Families) provides cash assistance to children under age 18 who are deprived of financial support of a parent.
Molly Manns
Associate Editor, Indiana Business Research Center, Indiana University Kelley School of Business
