Realtors Region 1—The View from STATS Indiana
Many statewide organizations in Indiana carve the state into regions that best represent either administrative, civic, constituent or engagement needs. One such group is the Indiana Association of Realtors™, which has recently embarked on a campaign to educate businesses, economic developers and other organizations on the importance of housing as part of attracting businesses to our state and the importance it plays in the site location equation.
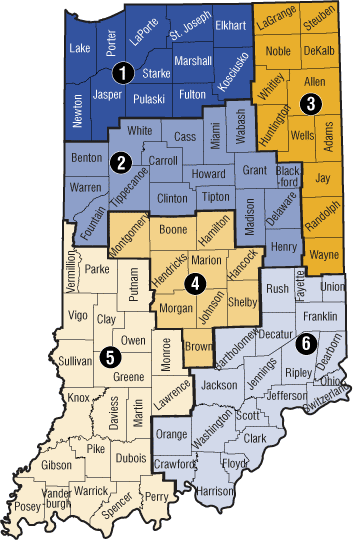
For years, InContext has published demographic profiles in these pages focused on metropolitan areas, economic growth regions and others. This year, we have decided to do two things: First was to establish the Realtors region as an automated drop-down option for the IN Depth profiles on STATS Indiana. Second, we will continue our InContext series on regions with a focus on the six Realtors regions (see Figure 1).
All of the information provided in these profiles is readily available on STATS Indiana (www.stats.indiana.edu) and always updated as soon as new source data arrive.
Figure 1: Indiana Realtors Regions, August 2009

Source: IBRC, using the Indiana Association of Realtors
Geography
Realtors Region 1 is bordered on the north by Lake Michigan, a significant asset for the area. It is also close to Chicago, one of the largest cities in the country. The region comprises a total of 267 square miles and includes 12 counties: Elkhart, Fulton, Jasper, Kosciusko, Lake, LaPorte, Marshall, Newton, Porter, Pulaski, St. Joseph and Starke.
Population
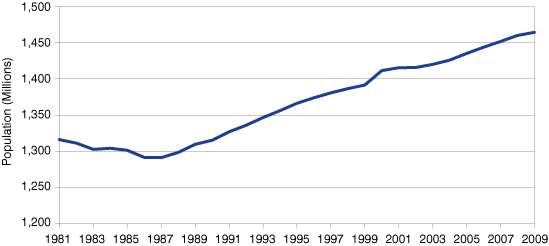
This region is the second largest among the six Realtors regions at 1.4 million people (see Figure 2). It is projected to approach 1.6 million by 2025, based on IBRC population projections. This particular region has some of Indiana’s largest counties, including Lake, Porter and St. Joseph. The largest cities in the region are shown in Table 1.
Figure 2: Region 1 Population Levels, 1981 to 2009

Source: IBRC, using U.S. Census Bureau data
Table 1: Largest Cities in Realtors Region 1, 2008
| Largest Cities | Population in 2008 | Percent of Region |
|---|---|---|
| South Bend | 103,807 | 7.1% |
| Gary | 95,920 | 6.6% |
| Hammond | 76,732 | 5.3% |
| Elkhart | 52,653 | 3.6% |
| Mishawaka | 50,026 | 3.4% |
| Portage | 36,976 | 2.5% |
| Merrillville | 33,057 | 2.3% |
| Goshen | 32,630 | 2.2% |
| Michigan City | 32,405 | 2.2% |
| Valparaiso | 30,429 | 2.1% |
Source: IBRC, using U.S. Census Bureau data
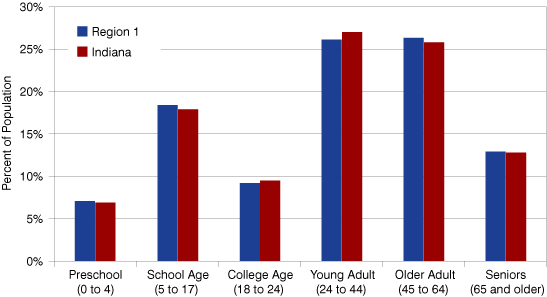
In terms of age structure, the region is quite similar to the state overall, but with slightly higher proportions of young children and older adults, which makes for an interesting mix of housing needs (see Figure 3).
Figure 3: Current Age Structure, 2008

Source: IBRC, using U.S. Census Bureau data
The region is among the more diverse in the state in terms of race and Hispanic origin, with 14.5 percent of its people identified as non-white and 10 percent as Hispanic (nearly double the state’s 5.2 percent).
Housing
Nearly 620,000 housing units existed in 2008, an increase of 9 percent since the 2000 Census. The vast majority of those were owner occupied (68 percent), with 25 percent renter occupied. The remainder were either vacant or seasonal housing (there were nearly 35,000 seasonal homes counted in Census 2000).
Labor Force
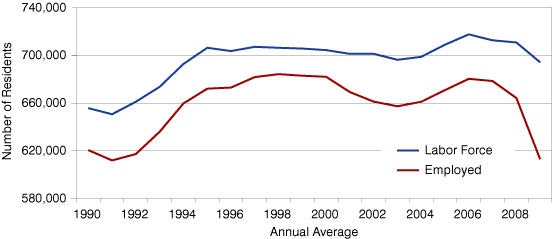
Today, more than 690,000 people living in the region are in the labor force, as shown in Figure 4. Of these, 88 percent are working and 12 percent are looking for work. It is a region that expects to commute to work, either to another city, a different county or even another state (think Illinois and Michigan).
Figure 4: Region 1 Resident Labor Force and Employment

Source: IBRC, using the Indiana Department of Workforce Development
Unemployment has struck hard in this region because of the transportation equipment industry and those that depend on it. Elkhart County on the eastern edge of the region has seen some of the highest unemployment, although for most of the counties in the region, including Elkhart, unemployment levels have begun to subside. This is in part due to some new jobs coming to the area, but also due to people leaving the labor force to return to school, sign on for training, start their own business, stay home with children, or take early retirement.
Work
Manufacturing is by far the largest employer, with more than 140,000 jobs estimated in that industry in 2008. A distant second is health care and social services (75,000). See Table 2 for a ranked list of jobs by industry.
Table 2: Realtors Region 1 Jobs by Industry, 2008
| Industry | Establishments | Establishment LQ | Jobs |
|---|---|---|---|
| Total | 32,657 | 1.00 | 618,089 |
| Manufacturing | 2,478 | 1.92 | 142,485 |
| Health Care and Social Services | 2,794 | 1.15 | 75,271 |
| Retail Trade | 4,683 | 1.27 | 71,231 |
| Educational Services | 589 | 0.96 | 56,286 |
| Accommodation and Food Services | 2,682 | 1.09 | 47,893 |
| Construction | 3,755 | 1.18 | 32,591 |
| Wholesale Trade | 2,300 | 1.02 | 24,490 |
| Administrative, Support and Waste Management | 1,482 | 0.79 | 24,404 |
| Public Administration | 480 | 0.98 | 23,670 |
| Other Services (Except Public Administration) | 2,963 | 0.63 | 19,080 |
Source: IBRC, using U.S. Bureau of Labor Statistics
Economic Clusters
Recent work by Purdue University and Indiana University has focused attention on identifying the type and size of industry clusters in regions across the United States. The following table identifies those clusters in this region, focusing on the number of business firms in each cluster and their location quotient, which helps identify a cluster's exporting capacity (that is, likelihood it is providing goods and services outside the region). Any LQ that is larger than 1.0 indicates the cluster serves a wider region (domestically or globally) than just the local area. Most notable are those within manufacturing: transportation equipment has an LQ of 4.66 and primary metals manufacturing is at 3.19 (see Table 3). These data can also be viewed for the individual counties in the region by going to www.statsamerica.org/ii2/ and going to the Industry Cluster tool.
Table 3: Realtors Region 1 Industry Clusters, 2008
| Description | Cluster Establishments | Industry Cluster Establishment LQ |
|---|---|---|
| Total All Industries | 32,657 | 1 |
| Agribusiness, Food Processing and Technology | 557 | 1.07 |
| Manufacturing Supercluster | 1,167 | 2.32 |
| Glass and Ceramics | 181 | 2.3 |
| Transportation Equipment Manufacturing* | 260 | 4.66 |
| Computer and Electronic Product Manufacturing* | 45 | 0.66 |
| Education and Knowledge Creation | 748 | 1.06 |
| Advanced Materials | 1,070 | 2.1 |
| Chemicals and Chemical Based Products | 529 | 2.09 |
| Printing and Publishing | 586 | 0.82 |
| Business and Financial Services | 4,052 | 0.8 |
| Primary Metal Manufacturing* | 69 | 3.19 |
| Electrical Equipment, Appliance and Component Manufacturing* | 50 | 1.89 |
| Forest and Wood Products | 1,027 | 1.45 |
| Information Technology and Telecommunications | 1,095 | 0.7 |
| Energy (Fossil and Renewable) | 2,294 | 1.07 |
| Mining | 43 | 0.99 |
| Fabricated Metal Product Manufacturing* | 516 | 2.35 |
| Machinery Manufacturing* | 227 | 2.07 |
| Apparel and Textiles | 271 | 0.91 |
| Transportation and Logistics | 1,154 | 1.56 |
| Biomedical/Biotechnical (Life Sciences) | 1,133 | 1.43 |
| Defense and Security | 807 | 0.74 |
| Arts, Entertainment, Recreation and Visitor Industries | 723 | 0.75 |
*These are subclusters within the manufacturing supercluster
Source: IBRC, using U.S. Bureau of Labor Statistics and Purdue Center for Regional Development data
Conclusion
There is much more that could be shown and described, but the hope is that these regional views will give the reader just enough to want more. You can go to STATS Indiana and STATS America (a companion site recently released as part of an EDA project) and explore the wealth of data, news and research articles available.
Carol O. Rogers
Deputy Director, Indiana Business Research Center, Indiana University's Kelley School of Business
