The South Bend-Mishawaka Metro Story: Told by STATS Indiana
This article is the 14th in a series about Indiana's metropolitan statistical areas (metros). All of the data used in this article can be found using the USA Counties and Metros Side-by-Side feature on STATS Indiana (www.stats.indiana.edu) unless otherwise noted.
The Area
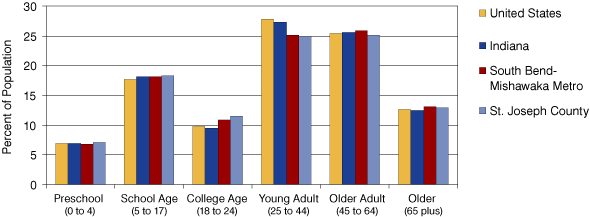
The South Bend-Mishawaka Metropolitan Statistical Area includes St. Joseph County in north-central Indiana and Cass County in south-central Michigan. These two counties had a population of 316,865 in 2008, with St. Joseph County contributing 84.2 percent of the metro population. South Bend-Mishawaka's population has slowly grown (6.9 percent) from 1990 to 2008, but lagged behind Indiana (15 percent) and the United States (22.2 percent). Figure 1 breaks the population down by age group.
Figure 1: Percent of Population by Age Group, 2007
Source: IBRC, using U.S. Census Bureau data
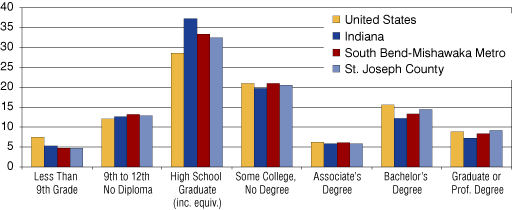
Although the South Bend-Mishawaka metro has nine1 colleges and universities in the area (including the University of Notre Dame), just 48.8 percent of the population has greater than a high school education, slightly less than the nation (51.7 percent) but more than Indiana (44.9 percent). It is no surprise that St. Joseph County has a higher proportion of bachelor, graduate or professional degrees than the rest of the metro as nearly 89 percent of the colleges and universities are in the county (see Figure 2).
Figure 2: Educational Attainment, 2000
Source: IBRC, using U.S. Census Bureau data
Jobs
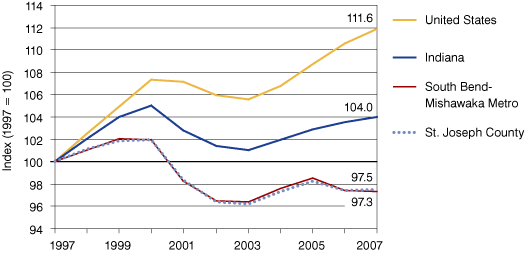
The South Bend-Mishawaka metro lost jobs in six out of the 10 years from 1997 to 2007 whereas Indiana and the United States only had three years and two years of job losses, respectively. The metro area began losing jobs in 2000. Indiana and St. Joseph County did not lose jobs until 2001, while the United States did not begin losing jobs until 2002. Although all four geographies rebounded in 2004, the metro area again lost jobs in 2006 and 2007 (see Figure 3).
Figure 3: Total Jobs Index, 1997 to 2007
Source: IBRC, using U.S. Bureau of Labor Statistics data
From 1997 to 2007, the South Bend-Mishawaka metro area lost 2.7 percent of their jobs with the majority (92.6 percent) lost in St. Joseph County, according to the Bureau of Labor Statistics. The metro area also lost 4.5 percent of their establishments (5.6 percent loss in St. Joseph County). In the same time frame, Indiana and the United States gained jobs (4 percent and 11.9 percent, respectively), with Indiana experiencing a 6.6 percent increase in establishments and the United States having a 22.1 percent increase in establishments.
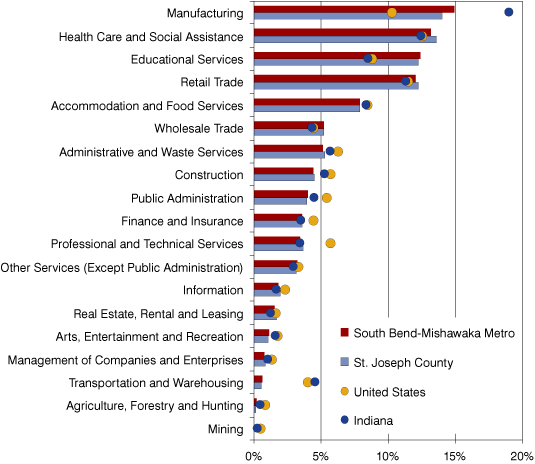
Manufacturing is St. Joseph County's largest industry in terms of employment (14 percent of total jobs); which is lower in proportion to the metro (14.9 percent) and state (18.9 percent), but higher than the nation (10.3 percent). The remaining top four industries for jobs in St. Joseph County are health care and social assistance (13.6 percent), educational services (12.3 percent) and retail trade (12.3 percent). Jobs in the retail trade and health care and social services are more popular in St. Joseph County than in the South Bend-Mishawaka metro, Indiana and the nation (see Figure 4).
Figure 4: Employment by Industry as a Percent of Total Jobs, 2007
Note: Data for utilities were unavailable for St. Joseph County and the South Bend-Mishawaka metro
Source: IBRC, using U.S. Bureau of Labor Statistics data
Wages
In 2007, St. Joseph County had 425 manufacturing establishments employing 17,335 people with an average annual wage of $51,572. After adjusting for inflation, wages in St. Joseph County have increased $2,267 from 1997 to 2007, a real increase of 6.6 percent. Meanwhile, the South Bend-Mishawaka metro increased 6.2 percent, Indiana increased 5 percent and the United States experienced an increase in wages of 11.5 percent. Of the industries with data available (i.e., excluding utilities), management of companies and enterprises paid the highest wages across all four geographies. Transportation and warehousing was the only industry in St. Joseph County and the metro to pay higher wages than the United States average (see Figure 5). Overall, wages in St. Joseph County were 82.3 percent of wages in the United States. In Indiana as a whole, wages were 84.4 percent of the nation's wages.
Figure 5: Industry Wages, 2007
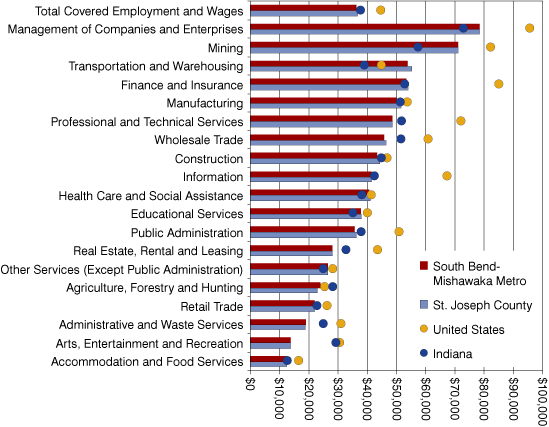
Note: Data for utilities were unavailable for St. Joseph County and South Bend-Mishawaka metro
Source: IBRC, using U.S. Bureau of Labor Statistics data
Conclusions
While wages in the South Bend-Mishawaka metro increased from 1997 to 2007, the area saw a decline in both jobs and establishments over the 10-year span. Meanwhile, Indiana and the United States experienced increases in all three measures. Due to the significant percentage of the South Bend-Mishawaka metro population working in the manufacturing industry, this county is likely to continue to be affected by the overall economic restructuring of the manufacturing industry.
Notes
- Learn More Indiana, "College Profiles," www.in.gov/learnmoreindiana/.
Tanya Hall
Economic Research Analyst, Indiana Business Research Center, Indiana University's Kelley School of Business
