Indiana's Elderly: How Are They Doing?
How well is Indiana’s elderly population doing? This was among the questions posed to this researcher by the Center for Aging and Community at the University of Indianapolis.1 Although there are multiple ways to approach the question, for this article we will focus on two dimensions: disability and poverty. These factors obviously have a significant impact on quality of life, and their frequency of occurrence tends to increase as people age. Knowing how our senior citizens fare on these issues and knowing where those affected tend to live may help both the public and private sectors to more effectively serve their needs.
Indiana’s Disabled Elderly
Figure 1 shows the percentage of elderly Hoosiers who are disabled according to the U.S. Census Bureau. The chart compares 1990 to 2000 for two age groups, and for two different types of limitations: go-outside-home disability and self-care disability.2 The population under consideration does not include those residing in nursing homes. Keep in mind that the Census Bureau added some additional disability categories in the year 2000 that were not available in 1990, so differences between those two years should be interpreted with caution. Even so, note how much greater the disability percentage is for the 75+ age group than it is for the 65-to-74 age group. In 2000, the incidence of the go-outside-home disability for the 75+ age group was about 15 percentage points greater than it was for the 65-to-74 group. For the self-care disability, that gap was smaller at nearly 9 percentage points.
Figure 1: Indiana's Disabled Elderly, 1990 and 2000
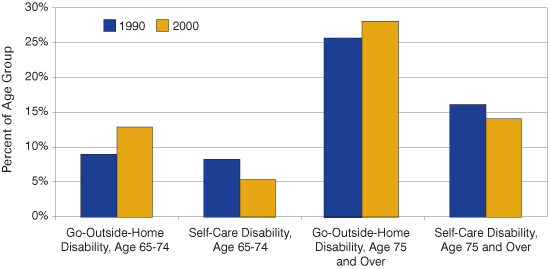
Note: While the "go-outside-home disability" was referred to as a "mobility limitation" in Census 1990, the language of the questions from which these data were derived stayed essentially the same.
Source: Thompson Analytics LLC, using data from the U.S. Census Bureau
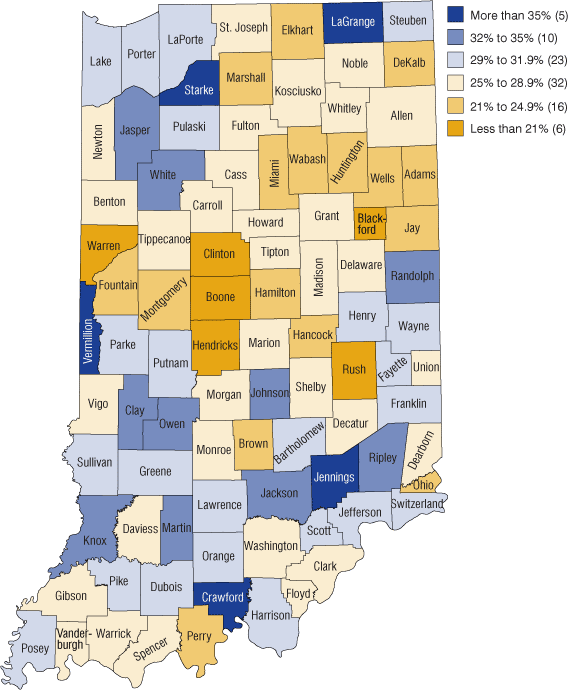
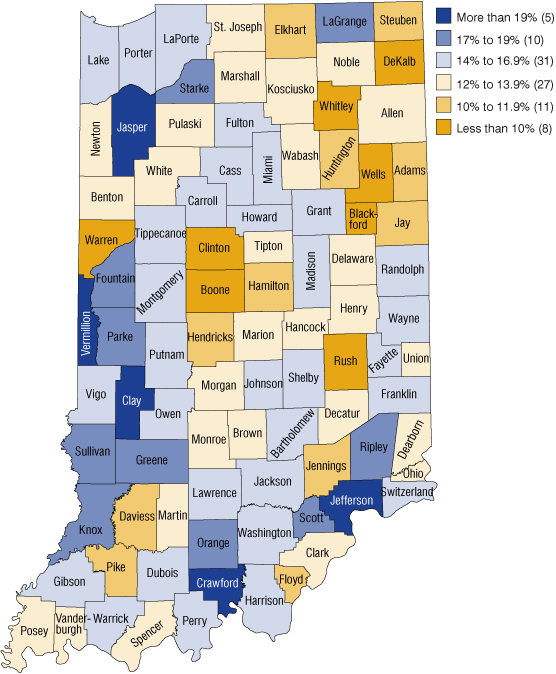
Figures 2 and 3 illustrate the percentage of disabled senior citizens in the 75+ age group, by county, according to Census 2000. Note that of the counties with very low or very high disability percentages, many have low populations to begin with, so the number of those affected is also relatively low. These maps, nonetheless, provide useful illustrations of where the greatest concentrations of the disabled elderly are across the state.
Figure 2: Percent of Population Age 75 and Older with a Go-Outside-Home Disability, 2000
Source: Thompson Analytics LLC, using data from the U.S. Census Bureau
Figure 3: Percent of Population Age 75 and Older with a Self-Care Disability, 2000
Source: Thompson Analytics LLC, using data from the U.S. Census Bureau
Elderly Hoosiers in Poverty
Figure 4 shows the percentage of elderly Hoosiers below the poverty level. Note that the rate for females is consistently higher than that for males, and this gap is substantially bigger for the 75+ age group. Some of this gap increase is explained by the fact that women tend to live longer than men, so they are more likely to continue living long after their life savings are depleted. They are also much more likely to be living alone.
Figure 4: Indiana Poverty Rates, 1990 and 2000
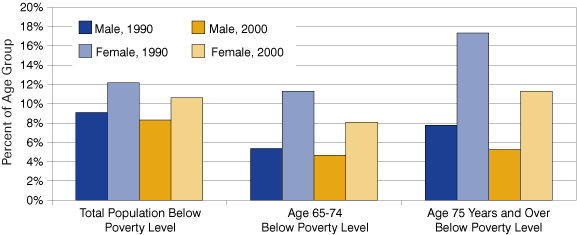
Note: Poverty figures correspond to the calendar year prior to the Census. The population for whom poverty status is determined excludes persons living in institutions, as well as individuals under age 15 who are unrelated to anyone within their household (e.g., foster children).
Source: Thompson Analytics LLC, using data from the U.S. Census Bureau
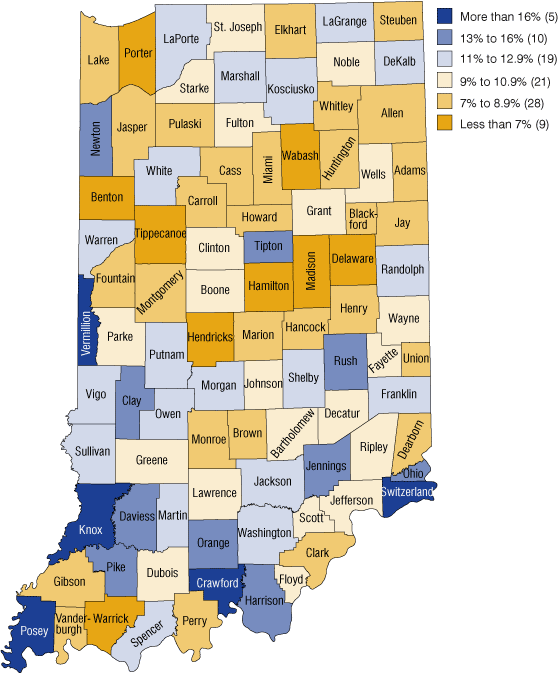
Figure 5 illustrates Census 2000 poverty rates by county for the 75+ age group. Note that two of the counties with the highest rates, Crawford and Vermillion, were also among the counties with the highest percentage of both types of disabilities (see Figures 2 and 3).
Figure 5: Percent of Population Age 75 and Older Below Poverty Level, 2000
Source: Thompson Analytics LLC, using data from the U.S. Census Bureau
Recent ACS Data
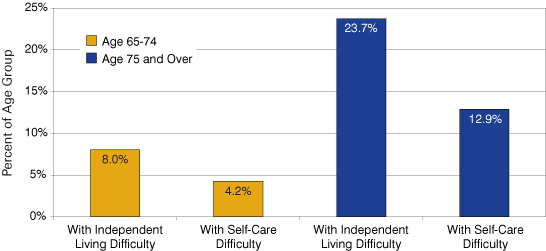
The data presented so far are dated, as it has been nearly a decade since the last census. What’s a researcher to do? Thankfully, the U.S. Census Bureau has released more recent estimates via the American Community Survey (ACS). Figure 6 gives us Indiana’s estimated disability percentages for 2008. Note that “go-outside-home disability,” which had been known as “mobility limitation” in 1990, is now referred to as “independent living difficulty” beginning with 2008 ACS reporting. Also, “self-care disability” is now known as “self-care difficulty.” Note that the percentage of those in the 75+ age group having independent living difficulties is about three times that for the 65-to-74 age group. The same is true for self-care difficulties. Note that we shouldn’t compare Figure 6 directly to Figure 1 due to questionnaire changes introduced since Census 2000. Changes to the disability question layout were implemented for the 2003 ACS, and then further refinements to those questions were adopted for the 2008 ACS.3 The 2003 changes remedied the tendency for some paper questionnaire respondents to declare a disability in error, and the 2008 changes further simplified the questions for improved clarity.4
Figure 6: Indiana's Disabled Elderly, 2008
Source: Thompson Analytics LLC, using data from the U.S. Census Bureau American Community Survey
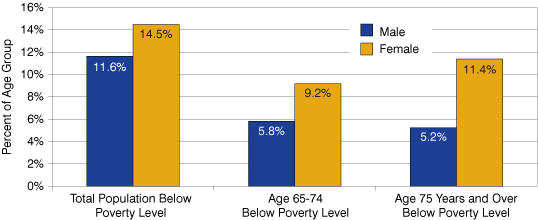
Figure 7 shows what appears to be the impact of the recession on poverty rates—not for the very oldest Hoosiers, but noticeable for the 65-to-74 age group, and especially for the overall population. Although the poverty rates in the 75+ age group were about the same for 2008 as they were for 2000, the rates for the 65-to-74 age group were about 1 percentage point higher for both men and women. The rates in 2008 for the overall population, however, were approximately 3 percentage points higher than those observed in 2000 for males, and 4 percentage points higher for females. The 2008 rates also exceeded those observed in 1990 when the recession of 1990-1991 was imminent. Of course, the overall figures are influenced in part by particularly high poverty rates for children age five and below as well as college-aged adults (ages 18 to 24), which exceed 20 percent. So although the elderly population definitely feels the effects of the recession, they appear to be more resilient than other vulnerable populations.
Figure 7: Indiana Poverty Rates, 2008
Note: The ACS measures poverty for the 12 months immediately preceding the survey, whereas the Census measures poverty for the previous calendar year.
Source: Thompson Analytics LLC, using data from the U.S. Census Bureau American Community Survey
Now What?
Those who engage in needs assessment, program planning, and policy development make a stronger case when using objective data as a foundation. Data such as those presented here provide this needed evidence base. As pointed out by Dr. Elaine Jurkowski in her recently published book, this is important because it provides “empirically driven background/rationale to support the need for specific directions for policy development or program planning.”5 Perhaps even more important is that it “also minimizes values that may be political as opposed to objective reasons for policy development.”6 In any case, this article will hopefully help advocates for our senior citizens as they pursue their mission.
Notes
- Readers may visit the University of Indianapolis Center for Aging and Community online at cac.uindy.edu.
- According to definitions in place for Census 2000, the U.S. Census Bureau defined disability as a physical, mental or emotional condition lasting six months or longer that makes it difficult to perform certain activities. A go-outside-home disability refers to having difficulty going outside the home alone to shop or visit a doctor’s office. A self-care disability refers to having difficulty dressing, bathing, or getting around inside the home.
- The 2008 ACS disability question results should not be compared directly to those of 2007 ACS or earlier. Neither should they be compared directly to disability results from Census 2000 or earlier. See http://census.gov/programs-surveys/acs/guidance.html for more information.
- See www.census.gov/topics/health/disability.html for more details about the changes in questionnaire layout and the magnitude of disability over-reporting prior to 2003.
- Elaine Theresa Jurkowski, Policy and Program Planning for Older Adults: Realities and Visions (New York: Springer, 2008), 59.
- Ibid., 60.
Vincent Thompson
President, Thompson Analytics LLC
