The Muncie Metro Story: Told by STATS Indiana
This is the 11th article in a series about Indiana's metropolitan statistical areas (metros). All of the data used in this article can be found using the USA Counties and Metros Side-by-Side feature on STATS Indiana (www.stats.indiana.edu).
The Area
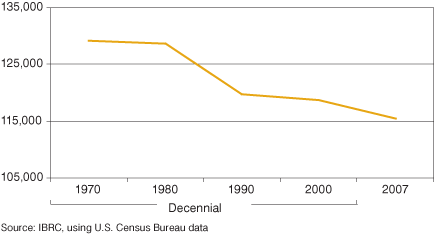
With 115,419 people in 2007, the Muncie metro area is much more densely populated than the state or the nation with 294 people per square mile, compared to 177 people per square mile in Indiana and 85 people per square mile in the United States. (To put that into perspective, however, the Indianapolis metro had 439 people per square mile and the Cincinnati-Middletown metro had 485 people per square mile.) Since 1970, Muncie's population has continued to decline (see Figure 1).
Figure 1: Muncie Metro Population, 1970 to 2007
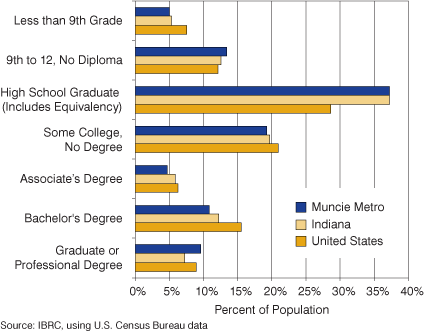
Ball State University is the major campus in the Muncie area, so it is not surprising that the population of college-age adults is much higher in the metro (16.8 percent of the total population) than in the state (9.5 percent) and nation (9.8 percent). A look at educational data from Census 2000, however, shows a mixed picture. Only 5 percent of the total population in the Muncie metro age 25 and older had less than a ninth grade education, compared to 7.5 percent in the United States. That said, the metro also has a higher proportion of adults 25 and older with some high school but no diploma (13.4 percent, compared to 12.1 percent nationally). The metro had a lower percent of its population with some college, an associate's degree and bachelor's degree, but a higher percent with a graduate or professional degree (see Figure 2).
Figure 2: Educational Attainment in the Muncie Metro, Indiana and the United States, 2000
Jobs and Wages
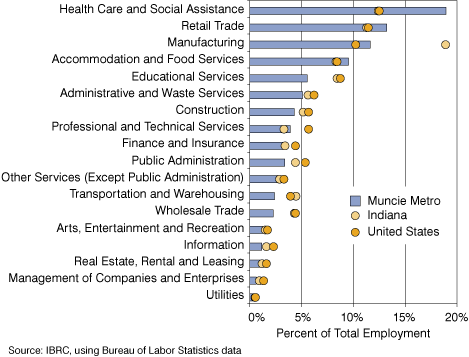
There were fewer jobs in the Muncie metro in 2007 than there were 10 years prior, but jobs have rebounded slightly since the low point in 2005. The health care industry employed more than any other industry in the metro in 2007, providing more than 9,100 jobs. This industry also had a higher proportion of jobs in Muncie than it did in the state or nation (see Figure 3). Retail trade and accommodation and food services were the only other industries where the metro had a higher percentage of employment than both the state and nation—quite common for university counties.
Figure 3: Percent of Employment by Industry in the Muncie Metro, Indiana and the United States, 2007
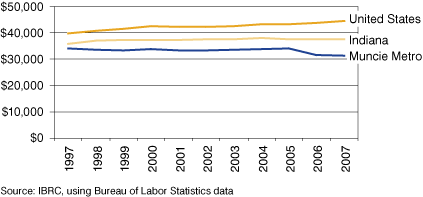
The Muncie metro saw a decline in wages following the bottoming out of jobs in 2005. After adjusting for inflation, the average wage per job fell from an average of $34,149 in 2005 to $31,559 in 2006. Unfortunately for the metro, that number dropped again, albeit more slowly, in 2007 (see Figure 4).
Figure 4: Average Wage per Job in the Muncie Metro, Indiana and the United States, 2007
Wages in the metro and Indiana were lower than wages in the United States across each of the major industry sectors (see Figure 5).1 Management of companies and enterprises paid the most in 2007, averaging $66,504 for the year. Utilities closely followed at $62,941 on average. The three industries with the most employees were scattered across the gamut when it came to wages: health care and social assistance paid $34,498 in the metro, manufacturing paid $46,429, and retail trade averaged $19,715.
Figure 5: Wages by Industry in the Muncie Metro, Indiana and the United States, 2007
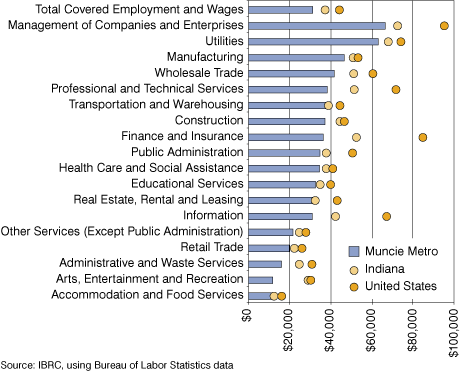
The biggest gap in wages between the metro and the United States was in the finance and insurance industry, where the U.S. average was more than double Muncie's average annual wage of $36,338. The smallest gap was in the low-paying accommodation and food services industry, where the U.S. paid about $5,300 more than the metro over the year.
Conclusion
After a longer delay in recovery than most areas experienced from the 2001 recession, the most current data show Muncie pulling through. However, these data do not capture any of the current recession-related news. For example, Borg Warner's Muncie plant is scheduled to close in 2009,2 as is Graphic Packaging International. Meanwhile, Brevini is supposed to build a facility that will create 450 jobs.3 Like much of Indiana, Muncie is being forced to adapt to a tough economy that isn't as reliant on auto manufacturing as it used to be.
Notes
- Data for agriculture, forestry and hunting as well as data for mining were not disclosable for the Muncie metro.
- Dagney Faulk, “Muncie Forecast 2009,” Indiana Business Review, 83 (4), www.ibrc.indiana.edu/ibr/2008/outlook/muncie.html. Keith Roysdon, "Muncie box plant to close, ending 154 jobs," The Star Press, February 10, 2009. Available online at www.thestarpress.com/article/20090210/NEWS06/90210020.
- Dagney Faulk, “Muncie Forecast 2009,” Indiana Business Review, 83 (4), www.ibrc.indiana.edu/ibr/2008/outlook/muncie.html.
Molly Manns, Associate Editor
Indiana Business Research Center, Kelley School of Business, Indiana University
