Housing Market Meltdown Will Affect School Enrollments
The severe slowdown in housing starts will not only be felt on Main Street, but on the playground as well. School systems that experienced steady growth over the last decade may want to consider adjusting their enrollment projections.
For many suburban school districts, recent planning for facilities and teachers has been predicated on expanding school enrollments. Given the current contraction in the housing market and the steep drop in new construction, these districts will likely re-evaluate their enrollment projections.
Most school districts recognize that the primary driver for rising enrollment has been residential housing growth. In order to provide an outline of the likely environment many schools will be operating in, this article presents some recent construction history for three suburban Indianapolis districts, shown in Figure 1 as examples: Zionsville Community Schools (Boone County), Franklin Community Schools (Johnson County) and Hamilton Southeastern Schools (Hamilton County).
Figure 1: School Districts Analyzed
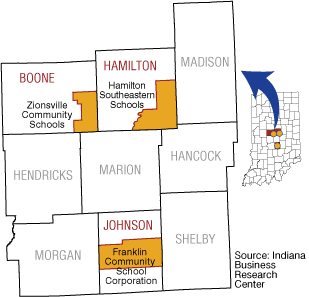
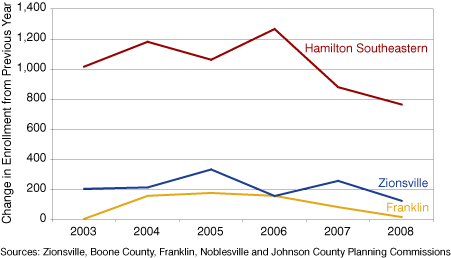
Figure 2 shows enrollment changes for these districts since 2003. Mis-anticipating these enrollment changes can have serious economic consequences in terms of teacher requirements, facility needs and income. Indiana's school districts receive a majority of their funding from the state on a per student basis based upon official enrollment counts taken in September of each year. Given that school districts spend around $10,000 per student each year according to the Indiana Department of Education, if “budgeted” (or forecast) enrollment diverges from actual enrollment significantly, then the financial consequences can be dire. For example, if Zionsville Community Schools had budgeted for 250 new students in 2006, they would have had about a million-dollar financial shortfall.
Figure 2: Enrollment Changes for Hamilton Southeastern, Franklin and Zionsville School Districts, All Grades, 2003 to 2008
Each of the three sample districts had enrollment growth linked to the expansion of the housing stock in their respective areas. Enrollment for the Franklin Community Schools shows the same trendline as that of housing permits (see Figure 3). Enrollment growth in recent years in Hamilton Southeastern has slowed, as has the number of building permits (see Figure 4). Zionsville's change in enrollment followed the trend of building permits with the exception of 2006, when enrollment growth slowed but building permits climbed (see Figure 5).
Figure 3: Enrollment Change and Residential Building Permits for Franklin Community Schools, 2003 to 2008
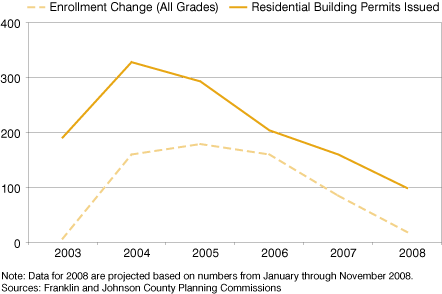
Figure 4: Enrollment Change and Residential Building Permits for Hamilton Southeastern Schools, 2003 to 2008
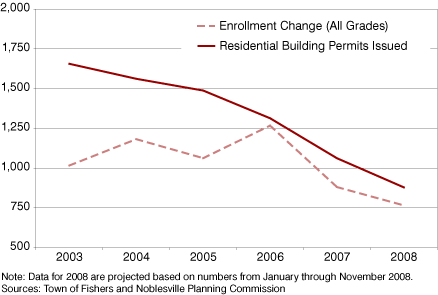
Figure 5: Enrollment Change and Residential Building Permits for Zionsville Community Schools, 2003 to 2008
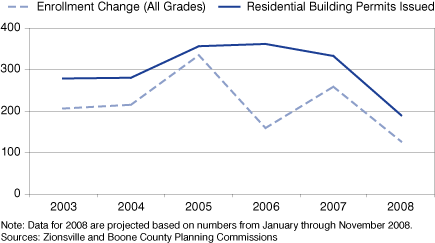
As a result of this relationship between housing permits and school enrollment, most school projection models use building permits and forecasted residential construction as key inputs.
Naturally, other factors deserve consideration as well. Forecasted school-aged population growth resulting from families moving into an area can be estimated by the type and price-point of the new housing. Increased enrollment growth from new construction differs among school districts based on the type of new housing and the types of households targeted for that housing. Two new housing units in the average district in Indiana are estimated to produce one new student. This is the case for Franklin Community Schools, which averaged 0.48 students per new housing unit from 2003 to 2008.
Conversely, new construction in some school systems—for example, Zionsville and Hamilton Southeastern—have a significantly greater number of students per new housing unit. Both Hamilton Southeastern and Zionsville averaged in the range of 0.75 students per new housing unit from 2003 to 2008. Because of their higher student-to-new-housing-unit ratio, these two school districts are at greater risk of missing their enrollment projections, which were calculated prior to the slowdown in housing construction.
As the earlier graphs show, new enrollments have slowly but steadily declined since the peak of the housing boom in 2005. Based on the November 2008 housing construction data from the Census Bureau, permits issued in the Midwest were more than 30 percent lower in October 2008 than in October 2007. The number of housing starts was 38 percent lower.
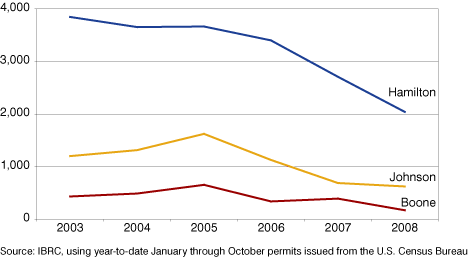
Figure 6 shows the trends in housing construction for the entire counties containing our three example school systems. The pace has slowed significantly and recent monthly data show continued weakening. Even in one of the state's fastest growing counties (in terms of population and housing), permits issued in Hamilton County during the first nine months of 2008 show a slow but steady decline.
Figure 6: Trends in Residential Building Permits for Boone, Hamilton and Johnson Counties, 2003 to 2008
The 2008 financial meltdown and economic recession will likely put an already cooling residential building market into a deep freeze. The slowdown in new home construction will also have ripple effects in many of Indiana's school systems. Rosy student enrollment projections for many high-growth suburbs will likely be put aside. The current economic conditions will not only be felt on Main Street, but in the teacher's lounge and the school yard as well.
For more information about school enrollment projections, please contact the IBRC at ibrc@iu.edu.
Chris Linn,
Economic Research Consultant
Indiana Business Research Center, Kelley School of Business, Indiana University
