Increasing Per Capita Personal Income in Indiana
This is one of those good news, bad news stories. First, some good news: In recent years, the unemployment rate in Indiana has been lower than all Midwestern states, except for Iowa and Minnesota. The bad news? Indiana's average earnings per job and personal income per capita remain below national and Midwestern averages. But there is an upside: Hoosiers' per capita personal incomes have been accelerating recently. Let's take a closer look at these trends.
Indiana's economy has been slowly gaining jobs. From 2001 to 2006, Indiana had a net increase of about 28,280 wage and salary jobs, or an increase of 94,700 jobs if we use the broader measure of employment that includes proprietors.1 That doesn't sound too impressive until one considers that Indiana lost more than 41,000 wage and salary jobs from 2001 to 2003. Since 2001, the lowest point for economic output during the last economic slowdown, total employment has increased at an average annual rate of 0.5 percent. Over the same time period, U.S. employment increased at an average annual rate of 1.3 percent. Figure 1 shows that Indiana and the rest of the Midwest continued to lose jobs after the official end of the recession (November 2001), while employment for the nation as a whole regained its footing more quickly.
Figure 1: Employment Growth in Indiana, the Midwest and the United States, 2001 to 2006
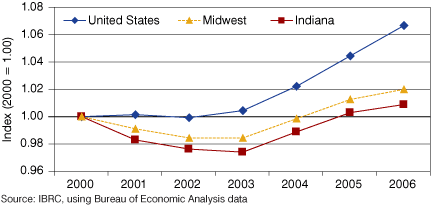
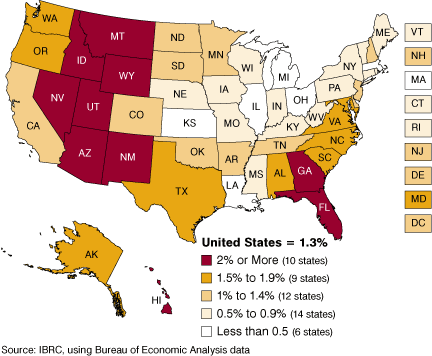
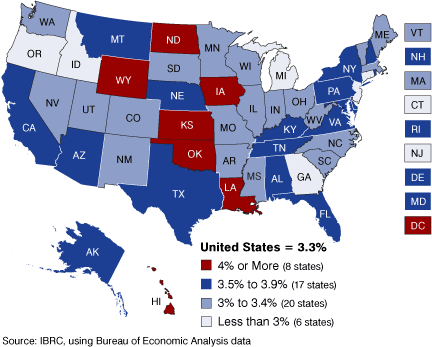
Figure 2 shows how Indiana's job growth has done relative to the rest of the country. Indiana's 0.5 percent average annual growth rate in employment is well behind many Western states, plus Florida and Georgia—which have enjoyed employment growth of more than 2 percent.
Figure 2: Average Annual Rate of Change for Total Employment, 2001 to 2006
Without adjusting for inflation, average earnings per job in Indiana grew faster between 2000 and 2004 than in the Midwest or the United States. In 2006, however, the state's rate of growth in average earnings per job fell slightly below the average for the United States (see Figure 3).
Figure 3: Growth in Average Earnings per Job in Indiana, the Midwest, and the United States, 2001 to 2006
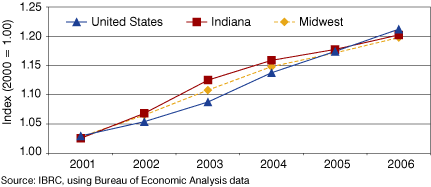
The change in the trend since 2004 from faster than the national average to slower than the national average means that the gap between the national average earnings level and Indiana's has widened. Among its Midwestern neighbors, Indiana finds itself in the middle tier in terms of both its level and recent growth in average earnings per job (see Figure 4). Figure 5 shows how all the states compare in average earnings per job growth from 2001 to 2006. Only two states were in the top 10 for both growth rate in employment and average earnings per job: Wyoming and Hawaii. Two states share the dubious distinction of being in the bottom 10 for both growth rate in employment and average earnings per job from 2001 to 2006: Michigan and Ohio. In contrast to the rate of employment growth, the growth rate for average earnings per job in Indiana is in the middle of the pack, placing the state 30th in the country and close to the national average.
Figure 4: Average Earnings per Job in the Midwest
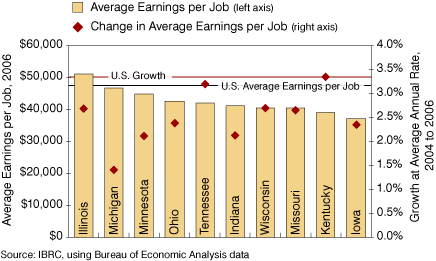
Figure 5: Average Annual Rate of Change in Average Earnings per Job, 2001 to 2006
While the middle of the pack may not be such a bad place to be, Indiana's position is largely attributable to the spurt early in the time series, as Figure 3 shows. More recently, Indiana's rate of growth in earnings per job has been 1.2 percentage points lower than the national average. If this trend continues, Indiana's average earnings will continue to lose ground relative to most other states and, to the degree that earnings per job drives per capita personal income, the acceleration in per capita personal income will be short lived.
Indiana's high concentration of manufacturing jobs may further drag down employment and earnings figures. Data from 2006 indicate that while average earnings for manufacturing jobs are among the fastest growing in the nation, the industry is one of the few that is losing employment across the United States. Please see "Shifting Gears: Recent Changes in Indiana's Economy" published in the Indiana Business Review that dissects recently released sector-by-sector data that may help explain the dynamics underlying Indiana's income per capita and average earnings per job.
Indiana Counties
From 2001 to 2006, Hamilton County gained the most employment in absolute terms (nearly 32,000) and was second in terms of average rate of growth, just behind Hendricks County. Marion County was a net job loser from 2001 to 2006, dropping 5,300 jobs over the period. However, from 2005 to 2006, the county employment situation turned around and Marion County gained 5,300 jobs.
In cases like Marion County, the five-year average provides an inaccurate picture of recent and perhaps future performance. Trends or averages for several years may also fall short in providing insight to the dynamics of the local economy. Delaware County, hard hit by the restructuring automobile industry, is another case in point. While annual job loss averaged over 800 per year from 2001 to 2006, Delaware County gained nearly 1,000 jobs in 2006. There are, of course, counties where recent performance partially negated a positive five-year trend. Adams County, for example, gained more than 1,600 jobs from 2001 to 2005 but registered a loss of about 40 jobs in 2006.
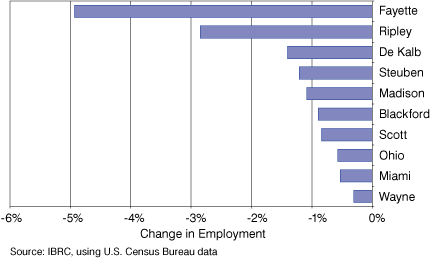
Over the five-year period, 63 counties gained in total employment, while 29 lost jobs (see Figure 6). Figures 7 and 8 highlight the counties with the highest rates of employment gains and the greatest rates of employment loss from 2005 to 2006.
Figure 6: Average Annual Rate of Change in Employment for Indiana Counties, 2001 to 2006
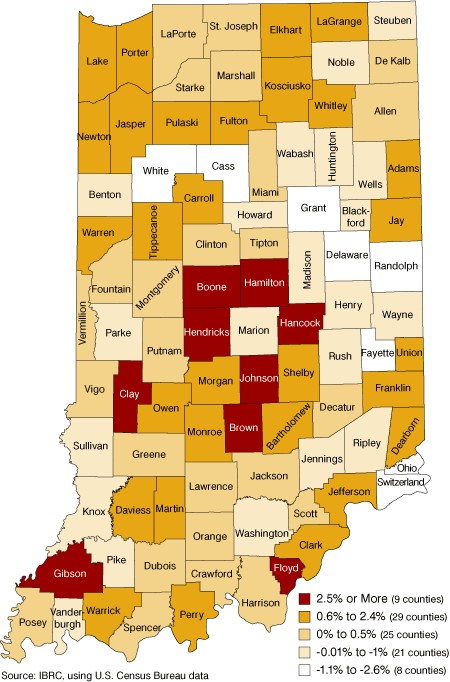
Figure 7: Ten Fastest Growing Counties for Employment, 2005 to 2006
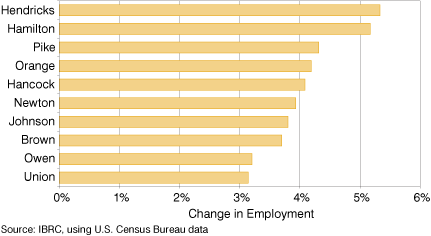
Figure 8: Ten Fastest Declining Counties for Employment, 2005 to 2006
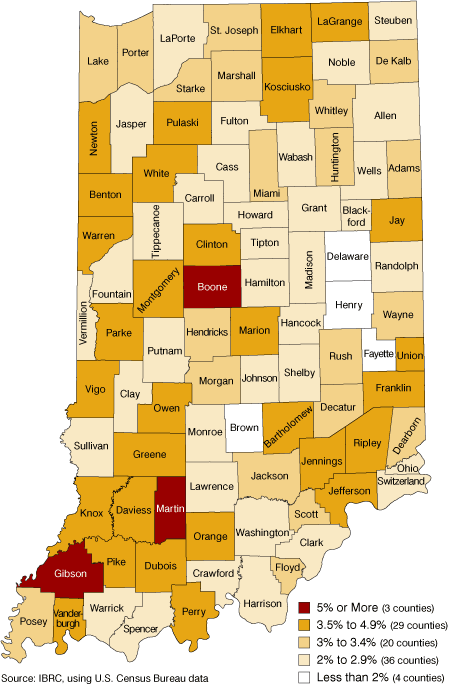
Between 2001 and 2006, the highest rate of growth in average earnings per job was in Gibson County with an annual average growth rate of more than 6.7 percent, although the gains have not been as robust recently. From 2005 to 2006, average earnings declined slightly. Fayette County was the only county to experience a decline in average earnings between 2001 and 2006, but a total of 19 counties saw a decline in average earnings per job from 2005 to 2006.
Figure 9 shows how Indiana's largest counties performed in terms of average earnings per job. Of those 17 counties in the figure, just two saw earnings growth for 2005 and 2006 exceed the trend from 2001 to 2006. Of all Indiana counties, roughly 85 percent have experienced a slowdown in the rate of growth in average earnings per job. It is not surprising then that the 2005 to 2006 rate of change for the state as a whole also lags behind the five-year trend. Figure 10 shows the growth rates for average earnings per job in Indiana for 2001 to 2006 county by county.
Figure 9: Growth in Average Earnings per Job for Indiana's Largest Counties, 2001 to 2006
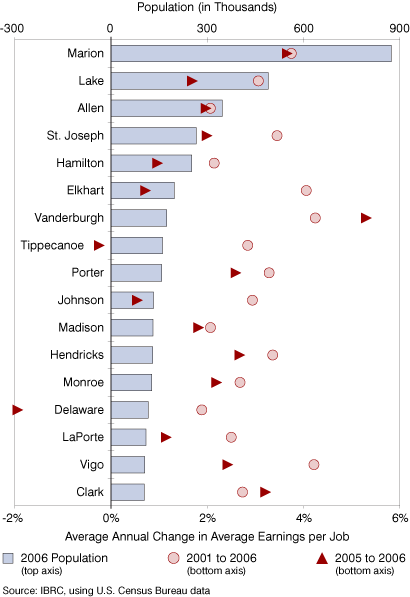
Figure 10: Average Annual Rate of Change in Average Earnings per Job, 2001 to 2006
From Earnings to Income
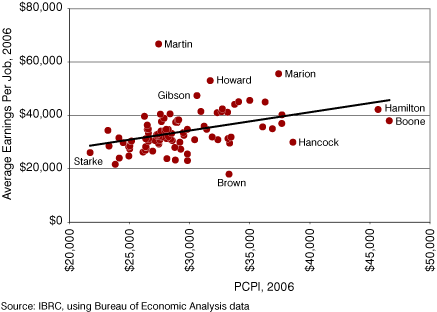
Employment growth and average earnings growth are two important data series that help address the questions about economic well-being. Per capita personal income (PCPI), however, probably better encapsulates relative economic well-being. As PCPI increases, so does one's standard of living, all other things equal (like the cost of living). As the geographic boundaries for analysis become smaller—for example, shifting from state to county boundaries—personal income will increasingly diverge from average earnings because personal income is measured based on place of residence. Average earnings, on the other hand, are measured based on place of work. As a result, average earnings that are rising in, say, Greene County, may show up as rising per capita personal income in adjacent Daviess or Sullivan counties. Nevertheless, PCPI and average earnings per job are correlated (see Figure 11).
Figure 11: PCPI and Average Earnings, 2006
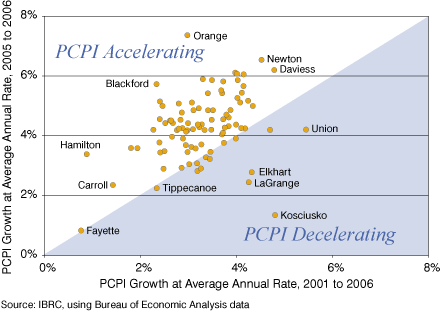
There is an encouraging sign in Indiana's PCPI data. Figure 12 plots the five-year average annual growth rate of PCPI against the 2005 to 2006 growth by county. Most counties are above the diagonal line, indicating acceleration in PCPI growth. Statewide, Indiana's PCPI has grown at an average annual rate of 3.3 percent from 2001 to 2006. Between 2005 and 2006, the average annual rate of growth was 4.4 percent.
Figure 12: Employment and Earnings Trends in Indiana Counties, 2001 to 2006
How can Indiana further improve its PCPI trends? In a word: education. The correlation between educational attainment and per capita personal income across states should come as no surprise. As Figure 13 shows, there is a positive relationship between the percentage of the state's population 25 and older holding at least a bachelor's degree and the state's PCPI. This relationship also holds within Indiana. Figure 14 plots the percentage of the county population holding a bachelor's degree against PCPI in the county.
Figure 13: PCPI and Educational Attainment in States
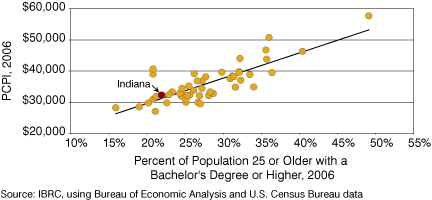
Figure 14: PCPI and Educational Attainment in Indiana Counties
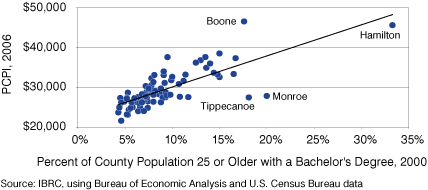
Counties with a particularly large collegiate population tend to have a low average PCPI. This is because traditional college students, with typically low income, contribute little to the county's aggregate personal income total. So while their high population numbers inflate the county's population metric (the denominator), their low incomes don't add much to the aggregate county personal income figures (the numerator), thus reducing PCPI.
While students may dilute the PCPI statistic in Monroe and Tippecanoe counties, once the students graduate and settle elsewhere in Indiana, they enhance Hoosier income and wealth. That's a good news story for everyone.
Note
- Although state-level data are now available for 2007, the data for 2006 were used in order to be consistent with the county-level analysis elsewhere in the article.
Timothy Slaper, Director of Economic Analysis
Indiana Business Research Center, Kelley School of Business, Indiana University
Alex Willey Cohen, Research Assistant
Indiana Business Research Center, Kelley School of Business, Indiana University
