Opportunity Varies by Geography: Long-Term Job Outlook in Indiana's Economic Growth Regions
Measuring Opportunity
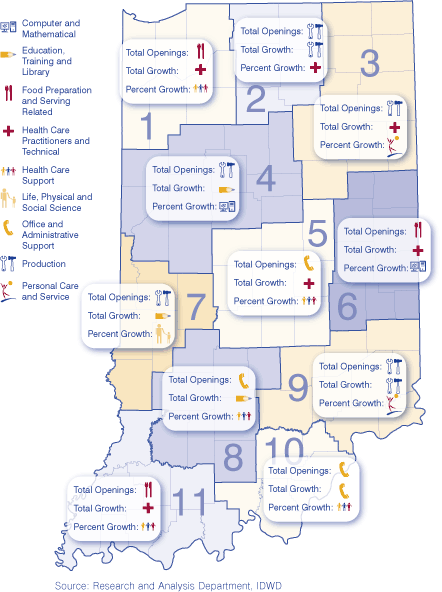
What type of job presents the best opportunity for Hoosier workers as we look toward the next decade? The answer depends on geography and how one defines “opportunity.” If opportunity is defined as the greatest number of job openings, then production occupations (including assemblers, machinists, machine operators, etc.) form the leading occupational group in many regions. If you define opportunity as rapid percentage growth or many new jobs, two groups of healthcare jobs answer the best opportunity question in most regions. Indiana's Department of Workforce Development has released occupational employment projections to 2014 for each of its 11 Economic Growth Regions (EGRs). Figure 1 shows the top opportunities in each region using three measures identified in the projections: percent growth (rate of growth), numeric growth (new jobs) and total openings (opportunities resulting from both job growth and job replacements).
Figure 1: Occupations Identified as Opportunity Areas in EGRs, 2004 to 2014
The following industries showed up as a “number one” in at least one of the three measured categories:
- Health care practitioners and technical: EGRs 1, 2, 3, 5, 6, and 11
- Health care support: EGRs 1, 5, 8, 10 and 11
- Production: EGRs 2, 3, 4, 7 and 9
- Computer and mathematical: EGRs 4 and 6
- Education, training and library: EGRs 4, 7 and 8
- Life, physical and social science: EGR 7
- Office and administrative support: EGRs 5, 8 and 10
- Food preparation and serving related: EGRs 1, 6 and 11
- Personal care and service: EGRs 3 and 9
Occupational Groups by Region
The production occupations group was the only occupational group to lead in two measures within the same region, being first in both numeric growth and total openings in EGRs 2 and 9. The same industry boosted production occupations to the top in both regions—anticipated growth in transportation equipment manufacturing. EGR 2 is by far the nation's leader for motor vehicle body and trailer manufacturing, and Honda's arrival in EGR 9 in 2008 will add many new production jobs.
Percent Growth Leaders by EGR
Health care support occupations are projected to have the greatest percent employment increase from 2004–2014 in five of the 11 economic growth regions, and will grow in all regions—ranging between 21 percent and 30 percent. Each of the regions has at least two occupational groups with over 20 percent growth. Regions 8 and 10 have the greatest number of occupational groups projected to grow by at least 20 percent, with nine occupational groups meeting that threshold for both regions. Region 9 has eight occupational groups with projected growth over 20 percent.
Numeric Growth (New Jobs) Leaders by EGR
Health care practitioners and technical occupations are projected to have the greatest numerical growth in five economic growth regions, and rates as second or third in the remaining regions. Only three other occupational groups attained first place in numerical growth in at least one EGR. Education, training and library occupations rated first in regions 4, 7 and 8. Production occupations rated first in EGRs 2 and 9, with office and administrative support occupations topping the list in Region 10.
Total Openings Leaders by EGR
Production occupations rated first in total openings in five regions (EGRs 2, 3, 4, 7 and 9). Two other occupational groups led by this measure in the other regions. Food preparation and serving occupations was first in EGRs 1, 6 and 11, while office and administrative support occupations led the way in EGRs 5, 8 and 10.
Conclusion
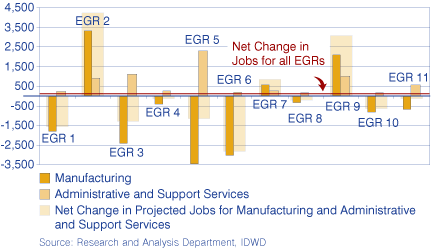
Three occupational groups dominate the job outlook in most regions—the two health care related groups and production occupations. Health care has been identified for many years as an occupational area with many opportunities. The fact that production occupations top the list in terms of job openings as well as new growth in some areas may come as a surprise. Despite significant losses in the manufacturing industry from 2000 to 2003 (amounting to 14 percent of the 2000 employment), the decline has been comparatively slight since then (less than 1 percent from 2003 to 2006). Production occupations will grow in regions with a manufacturing mix that has been and should continue to be strong—such as in EGR 2, where growth has occurred in motor vehicle body and trailer manufacturing each year since 2001 and is projected to grow through 2014. While there have been losses in the number of production occupations in some regions within manufacturing, every region is projected to grow in production occupations within the administrative and support services industry, as manufacturers move toward increased labor contracting for their staffing needs (see Figure 2). Contracted employees are at times retained as permanent employees after the contract period.
Figure 2: Production Occupations Projected Growth from 2004 to 2014

The complete results of the Occupational Projections 2004–2014 for Indiana's Economic Growth Regions can be found at www.hoosierdata.in.gov. Employment data for each detailed occupation within its major group and a breakdown of each occupation by industry is included in each EGR occupational projections report, as well as typical educational and training requirements for each occupation.
Source
All projections data for this article were produced by the Research and Analysis Department, Advance Economic and Market Analysis Group, Indiana Department of Workforce Development.
Jon Wright, Research and Analysis Department
Advanced Economic and Market Analysis, Indiana Department of Workforce Development

