The Top 20 Counties in Indiana: Magnets for Growth
The Largest 20
Indiana's population clocked in at 6.3 million in 2006 and more than half (3.4 million) of that population resides in just 20 of its 92 counties (see Figure 1).
Figure 1: Most and Least Populated Counties in Indiana, 2006
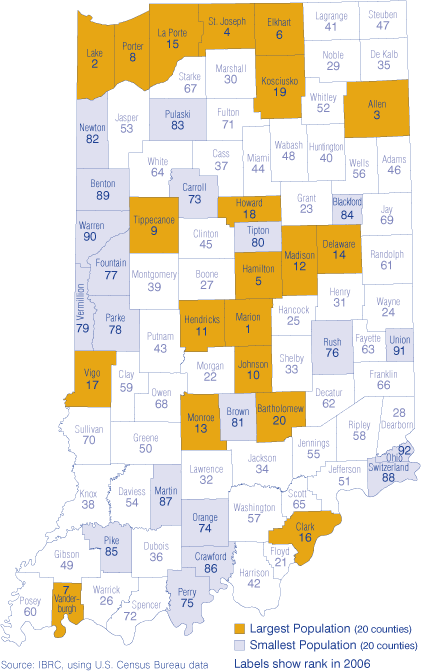
Most significantly, the largest twenty counties made up 80 percent of the state's population increase of 233,000 in the six years since the 2000 census. Within those 20 counties, a mere six accounted for 67 percent of that population increase and are part of the state's metropolitan areas of Indianapolis, Fort Wayne, Gary and Elkhart.
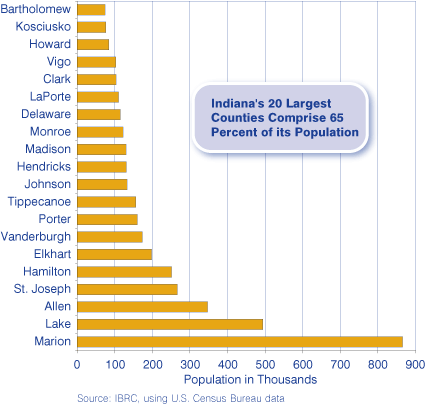
Of course, as shown in Table 1, not all of the top 20 are growing. Four counties saw population declines ranging from -464 (Howard County) to -3,890 (Delaware County). However, while the four counties lost a total of nearly 10,000 residents, the remaining 16 gained over 196,600 people. Hamilton County alone added 68,239 people in the past six years (a 37 percent growth). Figure 2 shows the population of the 20 largest counties in Indiana in 2006.
Table 1: Population Change in 20 Largest Counties
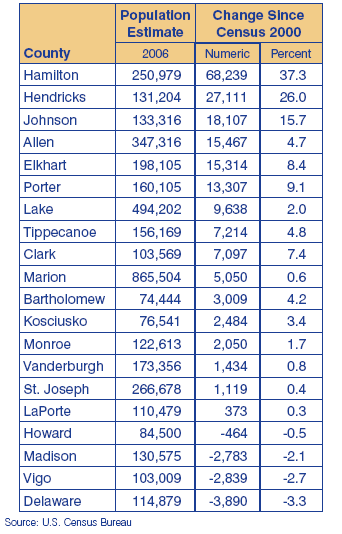
Figure 2: Population of the 20 Largest Counties in Indiana, 2006
What lies behind this population growth? All 20 counties experienced natural increase (meaning births outnumbered deaths) and nine of the 20 counties had positive net migration (meaning more people moved in than moved out). An increasingly significant portion of those population increases can be accounted for by international migration; that is, people migrating from countries outside the United States. In fact, all 20 counties experienced positive international migration.
The 20 Smallest
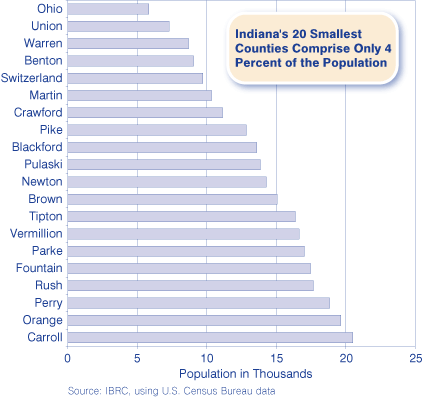
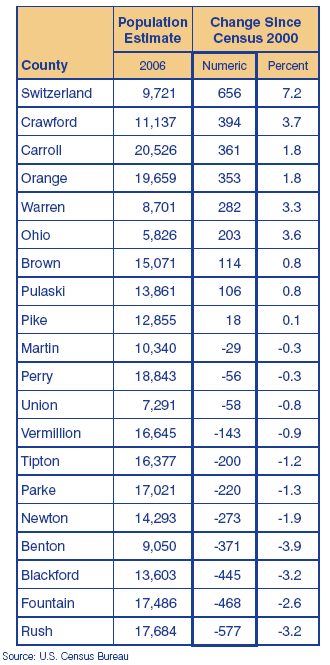
What's happening at the other end of the spectrum? About 276,000 people live in the state's 20 smallest counties (see Figure 3). Since Census 2000, nine of those counties grew a combined 2,488; however the remaining 11 had a total loss of 2,840.
Figure 3: Population of the 20 Smallest Counties in Indiana, 2006
All but two counties (Warren and Vermillion) experienced natural increase, and eight counties had positive net migration. Perhaps not surprisingly, migration from abroad is less of a factor for these counties, with just 13 of the 20 experiencing positive international migration.
The Largest 20 Counties Population Facts
- Sixty-five percent of Indiana's total population
- Eighty percent of Indiana's growth since 2000
- Seventeen of the 20 are part of large metropolitan areas
- Sixteen grew, while four declined since Census 2000
- Hendricks County moved up five ranks, from 16th to 11th
- Johnson County moved up from 13th to 10th
The Smallest 20 Counties Population Facts
- Four percent of Indiana's total population
- Combined for a net population loss of 352 residents since Census 2000
- Only seven of the 20 are part of large metropolitan areas
- Nine grew, while 11 declined since Census 2000 (see Table 2)
- There were no significant movements in ranks, with Pulaski and Blackford counties switching and Switzerland and Benton counties switching
Table 2: Population Change in 20 Smallest Counties
Carol Rogers, Deputy Director, and Rachel Justis, Managing Editor
Indiana Business Research Center, Kelley School of Business, Indiana University
