The Southern Indiana Bank Deposit Market
Banking has changed rapidly since the 1980s. Due to a record number of mergers and acquisitions, the average bank grew while the total number of banks declined.
With passage of the 1999 Financial Services Modernization (FSM) Act, also referred to as the Gramm-Leach-Bliley Act, banks can now engage in previously restricted activities, such as underwriting securities and insurance policies. (1) Since the FSM Act could lead to a wave of consolidation across commercial banks, insurance companies and investment banks, market concentration was likely to rise.
In this report, we investigate changes in southern Indiana's bank deposit market between 1998 and 2005 (six years after the FSM Act), and compare it with the Louisville, Indiana and Kentucky markets. For purposes of this article, southern Indiana includes eight Indiana counties, four of which belong to the Louisville Metropolitan Statistical Area (metro) that also includes nine Kentucky counties. (2)
Banks in the Deposit Market
As seen in Table 1, the amount of bank deposits in southern Indiana increased from $3.22 billion to $3.99 billion between 1998 and 2005. The number of offices increased from 136 to 151, whereas the number of banks decreased from 32 to 29. These trends are largely shared by Indiana, Kentucky and the United States. Therefore, as the FSM Act led to a wave of mergers and acquisitions, the number of banks declined while the number of retail offices increased.
Table 1: Banks in the Deposit Market
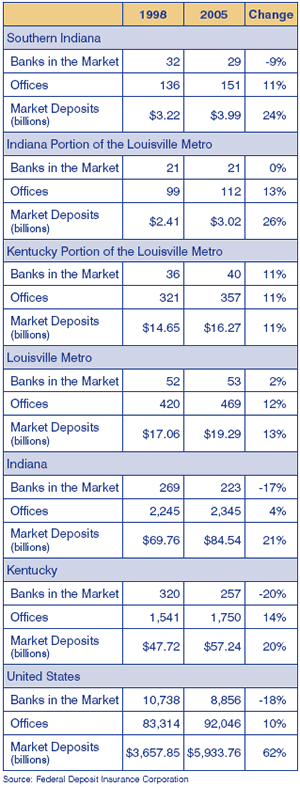
However, the Louisville metro did not experience a reduction in the number of banks, and this is especially true for the Kentucky side of the metro, which had an 11 percent increase in the number of banks.
Deposits in the United States went up 62 percent from 1998 to 2005. Unfortunately, this boost was shared by neither Indiana (21 percent) nor Kentucky (20 percent). As for the Louisville metro, the Indiana side had a much higher increase (26 percent) in the total amount of deposits than the Kentucky side (11 percent).
Bank Entry and Exit
The banking industry is no stranger to mergers and acquisitions. For example, in 1998, NBD Bank ranked first in regard to southern Indiana's deposit market share at 17 percent. It was acquired by Bank One Indiana in 1999, which was later acquired by Bank One National. Bank One National was then acquired by JPMorgan Chase. By 2005, JPMorgan Chase Bank had become the number one bank, with about 12 percent of the deposit market share.
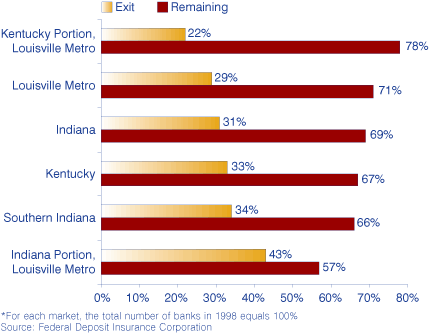
As seen in Figure 1, about 34 percent of banks that existed in 1998 exited the southern Indiana market by 2005, while 66 percent remained. (Remaining banks are defined as those having the same FDIC certificate number in 2005 as in 1998.) As for the Louisville metro, the Indiana counties have a much lower percentage of remaining banks (57 percent) than the Kentucky counties (78 percent), meaning the Indiana counties had a much higher proportion of exit banks (43 percent) than the Kentucky counties (22 percent); this implies that the deposit market of Indiana counties was more active and dynamic than that of the Kentucky counties between 1998 and 2005.
Figure 1: Percent of Banks Exiting or Remaining in Market
In both Indiana and Kentucky, remaining banks gained more market share since 1998 (see Table 2). For example, the remaining banks in southern Indiana held 62 percent market share in 1998 and 79 percent by 2005. More specifically, Community Bank of Southern Indiana ranked sixth in 1998 with a market share of 5 percent. By 2005, it had risen to second place with a market share of 9 percent.
Table 2: Market Share of Banks in Exit, Remaining and Entry
However, the market share of remaining banks in the Louisville metro stayed the same, due to the slight decrease in market share for the Kentucky counties and the increase in market share for the Indiana counties.
Market Concentration
Table 3 reports market concentration in 1998 and 2005, measured by the market share of the top 10 percent of banks and the Herfindahl Index. (3) Market concentration in southern Indiana has declined considerably, despite the consolidation trend in the overall banking industry since the 1999 FSM Act. More specifically, the top 10 percent banks' market share dropped from 39 percent to 29 percent, and the Herfindahl Index fell from 0.077 to 0.060. The Louisville metro demonstrates the same trend, indicating that the local deposit markets in southern Indiana and Louisville have actually become more competitive since 1998.
Table 3: Market Concentration
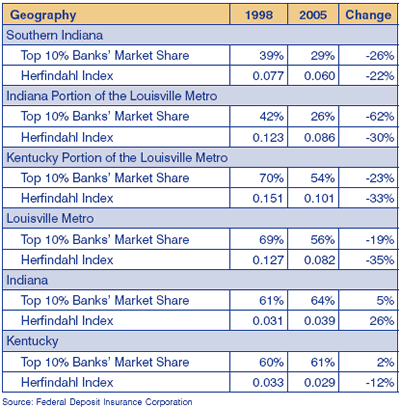
The Indiana side of the Louisville metro has a much lower level of concentration than its Kentucky counterpart. For instance, in 2005, the top 10 percent banks held 26 percent of the market share in the Indiana counties and 54 percent in the Kentucky counties.
Contrary to the local markets, Indiana overall has experienced an increase in market concentration (in line with the consolidation trend after the FSM Act), demonstrated by both a moderate increase in the top 10 percent banks' market share and an increase in the Herfindahl Index. However, the results for Kentucky are mixed.
Market Share by Bank Asset Size
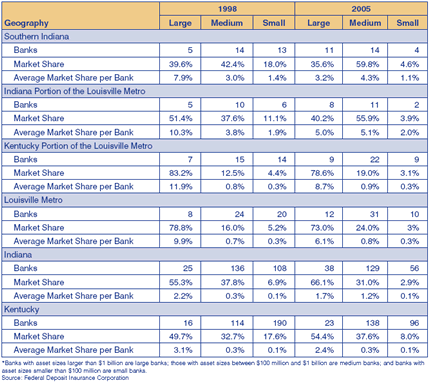
Table 4 shows the distribution of market shares among large (asset sizes larger than $1 billion), medium (between $100 million and $1 billion), and small banks (smaller than $100 million). In southern Indiana, medium banks hold more market share than large banks. From 1998 to 2005, the share of medium banks increased from 42.2 percent to 59.8 percent, while the shares of large and small banks both declined. Furthermore, medium banks have the highest average market share per bank in 2005. Hence, medium banks have become the major players in the local deposit market of southern Indiana.
Table 4: Market Share by Bank Asset Size*
In contrast, at the state level, large banks tend to hold the highest proportion of market share and their average market share per bank is also the highest. As for the Louisville metro, large banks dominated the market on both the Indiana and Kentucky sides in 1998. However, by 2005, medium banks dominated the market on the Indiana side.
County Shares of Southern Indiana
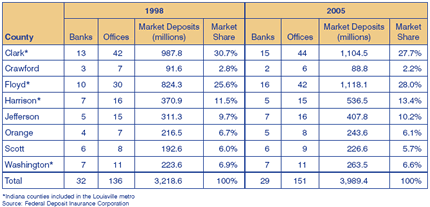
Interestingly, regardless of the considerable decline in market concentration and the large numbers of bank exit and entry, county-level market shares were relatively stable across time (see Table 5). The 2005 ranking (Floyd, Clark, Harrison, Jefferson, Washington, Orange, Scott and Crawford) is almost the same as it was in 1998, except that Floyd County rose from second place to first place, switching with Clark County. The counties in the Louisville metro hold more market share than any of the nonmetro counties, with the exception of Jefferson County (ranked fourth).
Table 5: Market Shares of Southern Indiana Counties
Together, the four Indiana counties of the Louisville metro held about 75 percent of the southern Indiana market share in 1998 and increased to 76 percent in 2005. Meanwhile, the four Indiana metro counties held about 14 percent of the entire Louisville metro market share in 1998 and grew to 16 percent in 2005.
Conclusions
The local banking market in southern Indiana is active in mergers and acquisitions, yet it has become more competitive and dynamic since 1998. Banks that existed in the region at that time gained more market share. Moreover, medium banks, not large banks, have become the dominant players in southern Indiana. This is particularly interesting, given that the medium and small banks are losing shares in the deposit market at the national level. (4) Although the 1999 FSM Act may have encouraged a consolidation trend in the entire banking industry, the local deposit market in southern Indiana has actually become much less concentrated since 1998.
Notes
- Cara S. Lown, Carol L. Osler, Philip E. Strahan, and Amir Sufi, "The Changing Landscape of the Financial Services Industry: What Lies Ahead?" FRBNY Economic Policy Review, October 2000.
- Southern Indiana includes Clark, Crawford, Floyd, Harrison, Jefferson, Orange, Scott and Washington counties. The Indiana portion of the Louisville metro includes Clark, Floyd, Harrison and Washington counties. The Kentucky portion of the Louisville metro includes Bullitt, Henry, Jefferson, Meade, Nelson, Oldham, Shelby, Spencer and Trimble counties. The Louisville metro is a combination of the Indiana and Kentucky portions.
- The Herfindahl Index measures the size of firms in relationship to the industry and is an indicator of the amount of competition among them. It can range from 0 to 1, moving from a very large amount of very small firms to a single monopolistic producer.
- Rober DeYoung, William C. Hunter, and Gregory F. Udell, "The Past, Present, and Probable Future for Community Banks," Journal of Financial Services Research, 25 (2-3), April 2004.
Uric B. Dufrene, Sanders Chair in Business, and Yan He, Associate Professor of Finance
School of Business, Indiana University Southeast


