Monthly Metrics: Indiana's Economic Dashboard
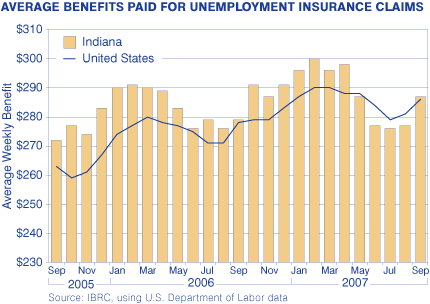
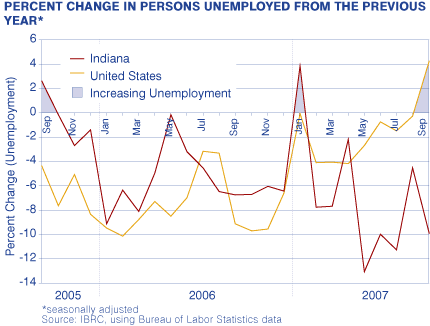
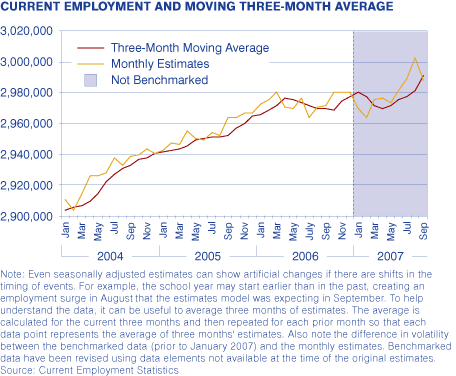
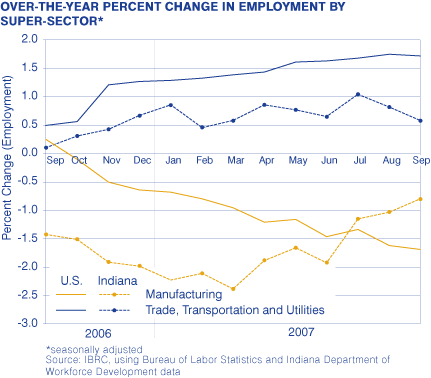
Change in Employment by Industry Super-Sector, 2006 to 2007*
| Industry | Indiana |
United States |
|
Change in Jobs |
Percent Change |
Percent Change |
|
| Total Nonfarm | 18,200 | 0.6 | 1.8 |
| Natural Resources & Mining | 200 | 2.9 | 6.3 |
| Leisure and Hospitality | 5,700 | 2.0 | 3.7 |
| Government | 4,800 | 1.1 | 1.0 |
| Other Services | 1,100 | 1.0 | 1.2 |
| Trade, Transportation & Utilities | 3,400 | 0.6 | 1.7 |
| Financial Activities | 700 | 0.5 | 1.1 |
| Professional & Business Services | 1,100 | 0.4 | 3.1 |
| Educational & Health Services | 1,300 | 0.3 | 3.7 |
| Information | 0 | 0.0 | 1.3 |
| Manufacturing | -4,500 | -0.8 | -1.7 |
Source: IBRC, using Bureau of Labor Statistics data
