Hoosier Babies
In 1915, the most popular baby names were John and Mary. In 2006, Jacob and Emily took the top name spots. These are fun trivia, but what do we actually know about babies born in Indiana or the women who give birth to them? This article will explore some of the demographic and social characteristics of women and children born in the Hoosier state.
Hoosier Births
There were 87,088 births in Indiana in 2005, according to the latest data available from the Indiana State Department of Health, up 5 percent from 10 years earlier, but down 0.7 percent from its peak in 2000.
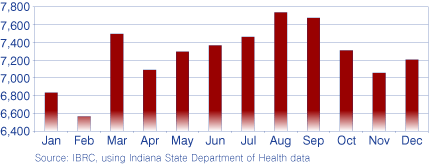
Given the holiday season about nine months prior, it may not be too surprising that August and September were the most popular months for baby birthdays in 2005, each laying claim to more than 7,600 babies. The fewest births took place in February, with less than 6,600 babies being born in that month (see Figure 1). On a per day basis, however, January experienced the fewest births in 2005, averaging 220 babies per day, compared to September's 256 babies per day.
Figure 1: Number of Births in Indiana by Month, 2005
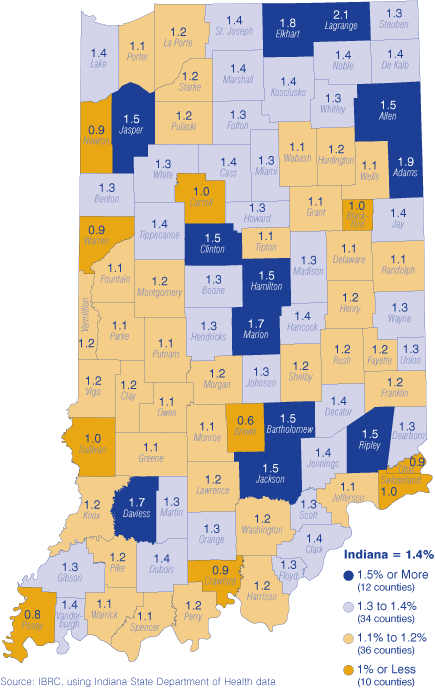
In 2005 in Indiana, live births made up 1.4 percent of the total population. Lagrange County was at the high end of Indiana's 92 counties for this measure, coming in at 2.1 percent. At the low end, there were six counties with live births making up less than 1 percent of the population, including Brown (0.6 percent) and Posey (0.8 percent), with Crawford, Newton, Ohio and Warren counties each at 0.9 percent (see Figure 2).
Figure 2: Live Births as a Percent of County Population, 2005
Married or Unmarried?
In 2004, non-marital births as a percent of all births ranged from 12.8 percent in Hamilton County to 51.8 percent in Grant County. (1) Numerically, Brown County experienced the fewest non-marital births with only 26 reported for 2004 while Marion County had the most. Marion County was one of three counties to report more non-marital births than marital births in 2004, with 51.4 percent of births coming from unmarried women. The other two counties were Grant (51.8 percent of all births) and Lake (50.1 percent of all births) counties.
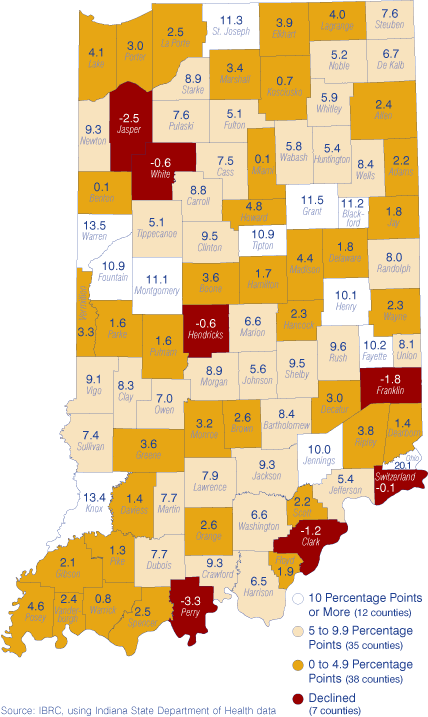
From 1999 to 2004, Indiana showed a definite trend toward more unmarried women giving birth. Non-marital births as a percent of all births increased in all but seven of Indiana's 92 counties over the five years. Ohio County saw the largest increase, up 20.1 percentage points from five years prior. Compare this to Indiana's 4.2 percentage point increase over that same time. Meanwhile, Perry County saw the largest percentage point decline in non-marital births, down 3.3 percentage points since 1999 (see Figure 3).
Figure 3: Percentage Point Change in Non-Marital Births, 1999 to 2004
According to data from the Census Bureau's American Community Survey, the median age for women at their first marriage was 24 from 2000 to 2003. In 2005, the median age for women to marry increased to 25. (2) Since that's the case, let's take a closer look at the age of the mother at the time of birth to see if perhaps women are still having children at the same age, despite their marital status.
Age of Mother
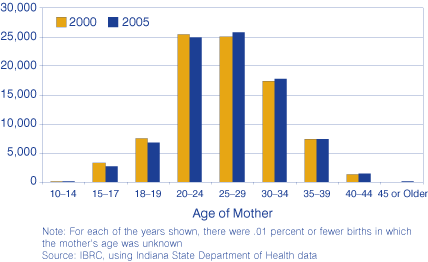
Now that we know women are waiting longer to get married, is it younger or older women who are giving birth to most of the babies born in Indiana? The number of babies born to mothers under the age of 20 (both married and unmarried) has decreased 1.5 percentage points from 2000 to 2005. In fact, compared to 2000, births to mothers in each age group from 10 to 24 have decreased (see Figure 4). Therefore, while the median age at first marriage data might indicate that women are having children at the same age and just are not married yet, a closer look indicates that fewer women under the age of 25 are having children.
Figure 4: Number of Live Births by Age of Mother
This brings into question whether fewer women are getting pregnant or if more women are terminating pregnancies, in which case they would not be classified under "live births." From 2000 to 2005, terminated pregnancies for those ages 10 to 24 dropped by 16.6 percent: those 25 and older saw a decline of 7.2 percent. Terminated pregnancies dropped for Indiana overall by 13.1 percent.
Prenatal Care
According to the Centers for Disease Control and Prevention (CDC), "smoking during pregnancy is the single most preventable cause of illness and death among mothers and infants." Knowing this could be the reason Indiana mothers who reported smoking during pregnancy has declined since 2000 from 20.2 percent to 17.9 percent. The same trend is seen for use of alcohol during pregnancy (down to 0.5 percent in 2005 from 0.7 percent in 2000). Nevertheless, lowering those statistics even further would give more Hoosier babies a better head start.
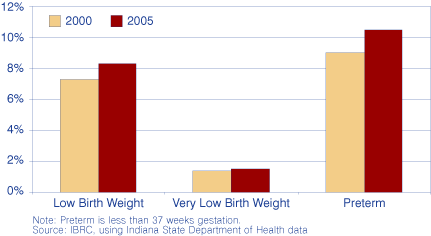
Also among the recommended prevention techniques used for pregnant women is prenatal care. Surprisingly, fewer women reported receiving prenatal care in the first trimester in 2005, down about 0.5 percentage points (more than 900 fewer women) since 2000. Unfortunately, the percent of preterm births, (3) low and very low birthweights have all increased over that time (see Figure 5).
Figure 5: Percent of Births with Reported Outcomes in Indiana, 2000 and 2005
Conclusion
Births and babies are a part of everyday life all over the world. Watching changing demographic and social trends in mothers and babies alike is important, aiding in such things as population and labor force projections that help us benchmark economic growth for the future.
Notes
- Data for 2005 were not available at the county level. Therefore, analysis for this section uses 2004 data.
- For median age estimates from 2000 to 2003, 0.1 years provides the margin of error at the 90-percent confidence interval. For 2005, the margin of error is 0.2 years.
- Preterm is less than 37 weeks gestation.
Molly Manns, Associate Editor
Indiana Business Research Center, Kelley School of Business, Indiana University
