Regional Perspective: Economic Growth Region 10
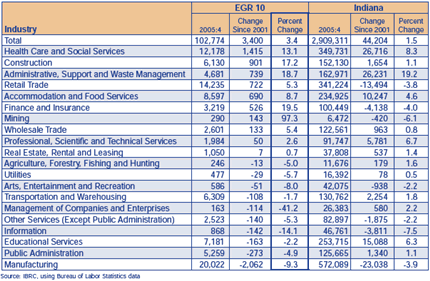
Four of the six counties in Economic Growth Region (EGR) 10 border Kentucky (Clark, Crawford, Floyd and Harrison); the remaining two counties are Scott and Washington. These six counties make up 4.4 percent of Indiana's population (about 273,340 people). That figure is up slightly from 1990, when the region made up only 4.3 percent of Hoosiers. From 2000 to 2005, EGR 10 grew by about 10,000 people. Only Floyd and Washington counties saw any kind of decrease over that time, and both of those were experienced from July 2002 to 2003 (see Figure 1).
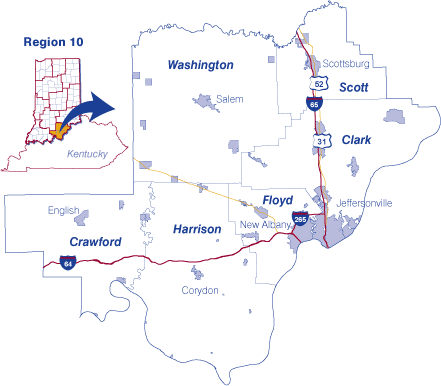
Figure 1: Population Change for Counties in EGR 10
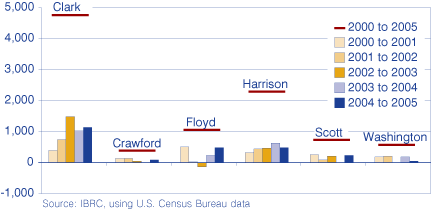
In 2005, Clark and Floyd counties made up more than their fair share of the population, with 37.2 percent and 26.3 percent, respectively. Meanwhile, Crawford County had the smallest population in the region with about 11,200 people, making up only 4.1 percent of the region (see Figure 2). Three cities in EGR 10 had a higher population than all of Crawford County: New Albany, the county seat of Floyd County, with 36,772 people; Jeffersonville, the county seat of Clark County, with 28,621 people; and Clarksville in Clark County with more than 21,000 residents.
Figure 2: Population Distribution EGR 10
Jobs
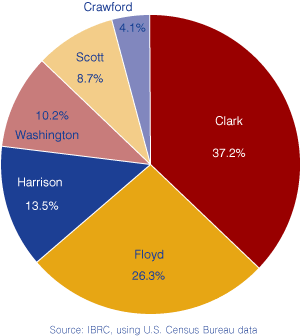
There were 5,741 establishments supplying 102,774 jobs in EGR 10 in the fourth quarter of 2005. The total number of jobs in the region increased 3.4 percent since 2001. Meanwhile, Indiana saw a 1.5 percent increase in jobs during that same time.
Manufacturing, retail trade, and health care and social services were the three industries in EGR 10 that each supplied at least 10,000 jobs, making up 45.2 percent of the region's total number of jobs. Therefore, it isn't surprising that two of the three largest employers in the region are hospitals (Clark Memorial and Floyd Memorial). The other is Beach Mold and Tool, a manufacturer of plastics and plastic products. (1)
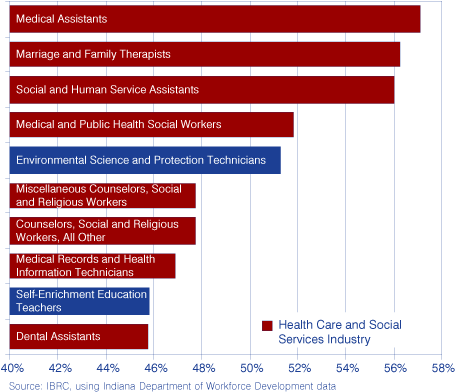
While manufacturing was among the top three industries to supply jobs, it also saw the largest numeric decrease in jobs from 2001:4 to 2005:4—at both the regional and state level. Meanwhile, health care and social services saw the largest numeric increase during that same time in both EGR 10 and Indiana (see Table 1). According to projections from the Indiana Department of Workforce Development, this trend is likely to continue, with eight of the top 10 fastest growing occupations from 2002 to 2012 included in the health care and social services industry (see Figure 3). The remaining two occupations were in the professional, scientific and technical services industry and the educational services industry, respectively.
Table 1: Change in Jobs in EGR 10 and Indiana, 2001:4 to 2005:4
Figure 3: Ten Fastest Growing Occupations in EGR 10 based on Percent Growth, 2002 to 2012
Wages
Region 10 increased its average weekly wages from 2001:4 to 2005:4 by $58, paying out $599 per week in wages but still lagging Indiana's average weekly wages by $106. The biggest difference was seen in the arts, entertainment and recreation industry, where the state paid $322 more per week than Region 10 paid. Only two industries in EGR 10 paid an average weekly wage higher than that of the state (see Figure 4).
Figure 4: Difference in Average Weekly Wages in Indiana and EGR 10, 2005:4
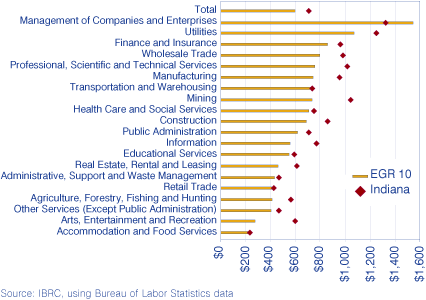
There were also two industries at the regional level that decreased in average weekly wages from 2001 to 2005: mining and educational services. Meanwhile, all industries increased wages at the state level.
Average weekly wages paid at the regional level ranged from $1,542 in management of companies and enterprises down to $224 in accommodation and food services. Indiana overall followed a similar pattern with management of companies and enterprises paying the most and accommodation and food services paying the least.
Commuting
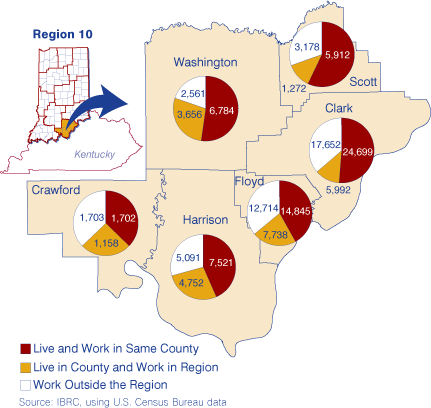
Of the 128,930 people who make up the regional labor force (defined as those who live in the region and work anywhere), only 47.7 percent choose to work in the same county in which they live and 66.7 percent stay within EGR 10 boundaries. Just over 3,100 people commute into the region for work while about 42,900 people live in the region but commute outside of it to work.
Figure 5 shows the county-level commuting patterns. Floyd County sends out more workers to other parts of the region (7,738) than any other county in EGR 10 while Clark County sent the most workers outside the six-county region (17,652). Of those workers who work in Region 10 but live elsewhere, neighboring Orange County contributes the highest number of workers (824).
Figure 5: EGR 10 Commuting Patterns
Notes
- The database maintained by the Indiana Department of Workforce Development contains listings of nearly 12 million U.S. employers. The employer information is provided by infoUSA.
Molly Marlatt, Research Associate
Indiana Business
Research Center, Kelley School of Business, Indiana University

