Growth Regions: A Side by Side Comparison
Throughout the course of 2006, we have provided an overview of each of the 11 economic growth regions (EGRs). To wrap up this series, we will take a look at how the EGRs compare to each other and the state of Indiana as a whole. Because of the dynamics of Indiana's capital city and surrounding counties, EGR 5 often shows up at the extreme of each comparison.
Population
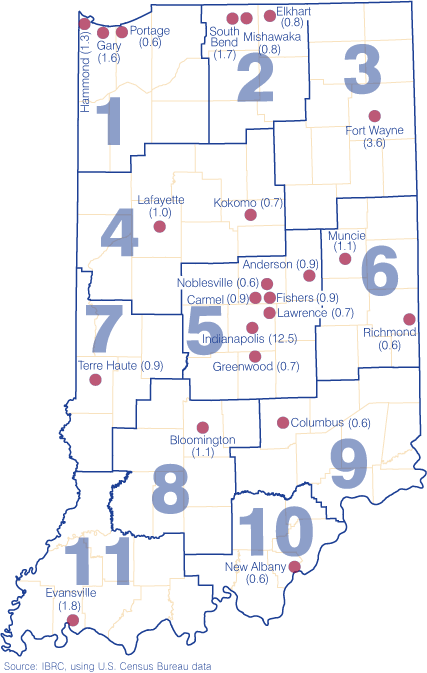
Since Indianapolis is the largest city in the state and is located in EGR 5, it isn't too surprising that more than one in every four Hoosiers (27.4 percent of the state's population in 2005) call this region home. EGR 1 made up the next largest portion of the state, with 13.5 percent of Indiana's 6.3 million people, which can be attributed in large part to its proximity to Chicago. EGR 7 is home to the fewest number of Hoosiers, making up only 3.5 percent of the state's population (see Figure 1). Major cities (that is, with a population of at least 35,000) can be found in each region (see Figure 2).
Figure 1: Population Distribution, 2005
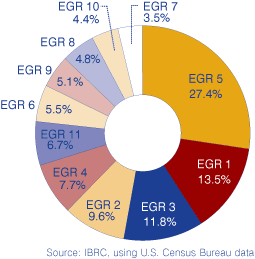
Figure 2: Percent of State's Population in Indiana's Major Cities, 2005
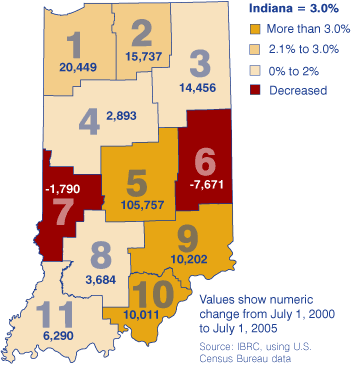
Since 2000, three regions have increased in population faster than the state's 3 percent rate, Regions 5, 9 and 10. Meanwhile, Regions 6 and 7 actually decreased in population over that time period (see Figure 3).
Figure 3: Change in Population by Region, 2000 to 2005
Jobs
Regions 5 and 3 employed the highest number of people in the fourth quarter of 2005, with more than 879,000 and 344,000, respectively. At the other end of the spectrum, EGR 7 employed the fewest number of people (about 85,000). This isn't too surprising considering Region 7 is also the smallest in population.
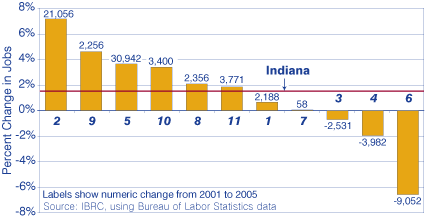
Since the fourth quarter of 2001, Indiana has seen a 1.5 percent increase in jobs. Six EGRs (Regions 2, 5, 8, 9, 10 and 11) surpassed this growth rate. At the same time, Regions 3, 4, and 6 experienced a decline in jobs since 2001, the worst of which was experienced in EGR 6 (see Figure 4).
Figure 4: Change in Jobs by Region, 2001:4 to 2005:4
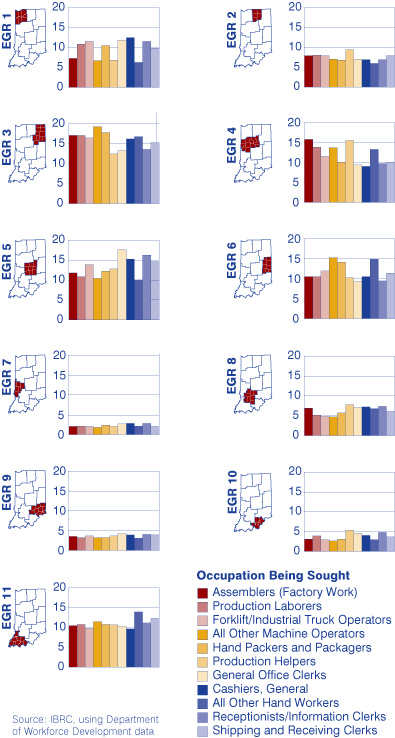
The Indiana Department of Workforce Development maintains a website used to generate reports about which jobs are most sought-after in Indiana. According to the report issued on September 10, 2006, most Hoosiers using the system are looking for assembly work (in factories) and production jobs. In fact, these were the top two jobs being sought after in every economic growth region. When looking at data for the top 20 occupations from each region individually, 11 showed up in every one. Figure 5 shows these occupations as a percent of the state total by region.
Figure 5: Percent of State Total Looking for Jobs in Specific Occupations by Region, September 2006
Wages
Corresponding to the pattern seen with employment, EGR 5 paid the highest average weekly wage in the fourth quarter of 2005 while EGR 7 paid the lowest, $788 per week vs. $579 per week (see Figure 6). Compare this to Indiana's average of $705 each week.
Figure 6: Average Weekly Wages, 2005:4
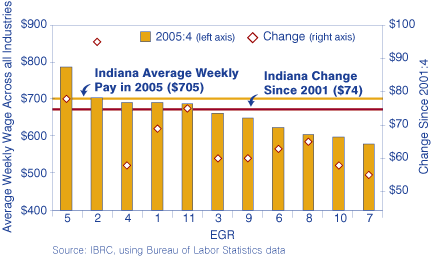
Since 2001:4, EGR 7 has also seen the smallest change in average weekly wages, increasing by only $55. The good news, however, is that every region did increase wages over the four-year span. Indiana's change in wages during that time was $74. Only three regions improved wages by more than that amount, including Regions 2, 5, and 11, with increases of $95, $78 and $75, respectively.
Commuting
For the reasons mentioned previously, it is not surprising that EGR 5 sends out and receives more workers than any other region, with 22,787 people leaving EGR 5 for other regions within the state and 47,290 people coming into EGR 5 to work. EGR 6 actually sends out nearly as many workers as EGR 5, with about 22,770 workers leaving EGR 6 and working elsewhere within the state (see Figure 7). Region 2 comes in second place on the receiving end, bringing in about 17,870 people from the other EGRs.
Figure 7: Most Work in their Region of Residence: Commuting Patterns for Indiana's 11 Economic Growth Regions, 2000
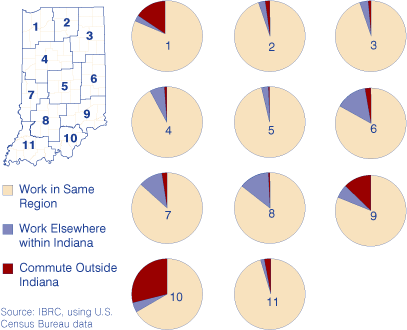
Indiana sends out approximately 146,900 workers to other states, and 39.1 percent of those people reside in EGR 1. More than 85 percent of the commuters leaving EGR 1 are heading to Chicago. In fact, 34.5 percent of all people commuting from Indiana to out of state are working in Cook County, Ill., home to the Windy City. EGR 10, which includes part of the Louisville metro area, was next in line for the number of workers sent to other states, making up 25.3 percent of the commuters who leave the state.
Molly Manns, Research Associate
Indiana Business Research Center, Kelley School of Business, Indiana University
