Improving Our Understanding of Employment Changes
Every month, state and federal agencies release data on employment changes. These data allow us to compare changes over time, and we put great weight on them for policy purposes; but the numbers can hide as much as they reveal.
Often, changes in the economy may be concentrated in one or a few sectors. The aggregate numbers hide that fact. We need a measure of dispersion to get deeper into the numbers, the breadth of a change across sectors of the economy.
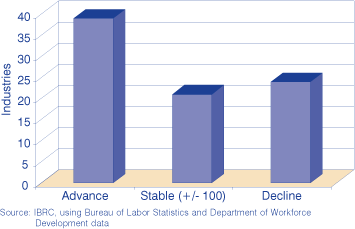
For example, between July 2004 and 2005, Indiana’s employment rose by 24,300 or 0.8 percent. It sounds dull, but when we get into the detail, we find that 39 of 84 industries increased in employment by more than 100 people, while only 24 declined by the same margin. At the same time, 21 sectors showed changes between -100 and +100, which we interpret as no change in employment (see Figure 1).
Figure 1: Over-the-Year Employment Change, July 2005

Several points are worth noting before we proceed. First, it is necessary to decompose the data provided by the Bureau of Labor Statistics (BLS) into more useful sectors. For example, we are given a figure for utilities and for electric power generation. However, our interest is in the residual: utilities minus electric power generation, which we label “other utilities.”
Second, BLS reports data in terms of hundreds of workers. That is perfectly understandable, but the difference between 1,500 and 1,600 may be nothing more than rounding. Hence, all changes of 100, positive or negative, are treated as no change.
A diffusion index takes the data in Figure 1 and converts it into a single number that can be tracked over time. If the growth in a sector is greater than 100, then the sector is assigned a value of 100. If there is no change in the sector, it is assigned a value of 50; and if the sector declines in employment, it receives a value of zero. These values are then multiplied by the number of sectors in each classification. The sum of these products is divided by the number of sectors, resulting in a diffusion index (see Table 1).
Table 1: Calculating the Diffusion Index

The diffusion index has a maximum value of 100 and a minimum value of zero. The higher the index value, the greater the number of advancing sectors. Values close to 50 indicate most sectors show no change. The more sectors in the analysis, the more likely the value of the diffusion will converge to 50 because there is more likelihood of individual sectors having little or no change. Similarly, diffusion indices calculated over short periods of time (a month or quarter) are likely to be closer to 50 for the same reason.
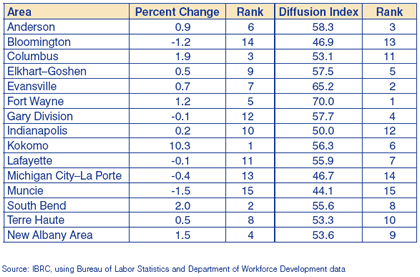
We can see how the diffusion index changes our perception in Table 2. Fort Wayne had an employment increase of 1.2 percent, fifth best in the state. The diffusion index, however, demonstrates that the Fort Wayne metro area led the state with a 70 in its diffusion index. Kokomo had the fastest rate of growth (10.3 percent), but a mediocre diffusion index of 56.3.
Table 2: Metro Areas Employment Measures, July 2004 to 2005

We may hope that diffusion indices will be produced with some regularity for Indiana so that our understanding of employment changes is enhanced.
Morton J. Marcus, Director EmeritusIndiana Business Research Center, Kelley School of Business, Indiana University
