Bankruptcies and Foreclosures in Indiana
Housing news across the nation has centered on the real estate “bubble” in some parts of the United States due to speculative buying. What is the real estate market like in Indiana and how many Hoosiers have gotten in over their heads? What trends can we discern by looking at bankruptcy and foreclosure data?
Indiana vs. the Nation—Bankruptcies
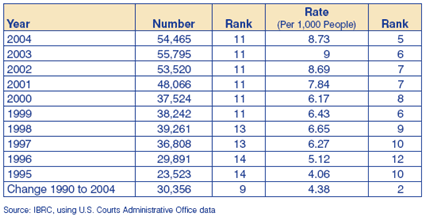
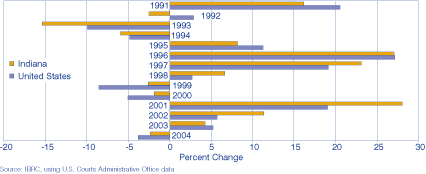
There were 54,465 bankruptcy cases that commenced in Indiana in 2004, a 2.4 percent decline (1,330) from the previous year. The nation, meanwhile, had a 3.8 percent decline (62,783), as shown in Figure 1. Like the United States, the vast majority of bankruptcy filings in Indiana are personal bankruptcies (99 percent). Since 1990, the share of business bankruptcies has fallen, while the share of personal bankruptcies has risen in both Indiana and the nation. During the recession, bankruptcies spiked 28 percent (10,542 new filings), but since 2001, the pace of bankruptcy filings decreased.
Figure 1: Percent Change in Annual Bankruptcy Filings from Previous Year, 1991 to 2004
Click for larger image
Hoosiers comprised 3.4 percent of the bankruptcy filings nationwide and ranked 11th in the number of filings. California led the nation with 7.7 percent of all filings; but since California is the largest state in terms of population, looking at the rate per 1,000 people will give us a better idea of how Hoosiers compare on this measure.
Unfortunately, our position deteriorates: For every 1,000 Hoosiers, approximately nine of them filed for bankruptcy in 2004, ranking Indiana fifth (see Table 1).
Table 1: Indiana's Total Bankruptcies over Time
Changes to Bankruptcy Law
Indiana averaged 13,615 bankruptcy filings for each quarter of 2004. Like the nation, bankruptcy filings declined between the second quarters of 2003 and 2004, but are up 10.9 percent in 2005 (see Figure 2). This reversal may be a result of the new bankruptcy law passed in April 2005, which went into effect in October. A USA Today article summarizes the changes: “Among the most noteworthy of the changes are new limitations on filing for personal bankruptcy, including barring those with above-average income from Chapter 7 (where debts can be wiped out entirely), except under special circumstances. Those deemed by a ‘means test’ to have at least $100 a month left over after paying certain debts and expenses will have to file a five-year repayment plan under the more restrictive Chapter 13 instead. People will also be required to get professional credit counseling before being allowed to file. (1) ” We can probably expect third quarter filings for 2005 to be up over the previous year as well, while people rush to get their cases filed as a Chapter 7 with the hope of starting over with a clean slate.
Figure 2: Percent Change in Second Quarter Bankruptcy Filings, 1997 to 2005

Click for larger image
Indiana Counties
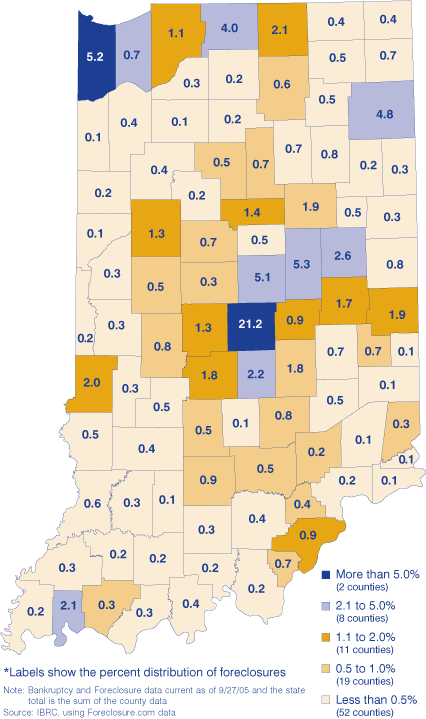
Very little bankruptcy and foreclosure data is available free to the public, and finding data more focused than the state level is a real obstacle. However, www.foreclosure.com provides daily updates of bankruptcy and foreclosure counts searchable by state, county or ZIP code. All information is acquired directly from the foreclosing lenders and government agencies. Figure 3 shows the percent distribution of foreclosures and bankruptcies across the state. Marion County contributed one-fifth of the bankruptcies and foreclosures, while the doughnut counties contribute a fair share as well.
Figure 3: Percent of Bankruptcies and Foreclosures, 2005
Click for image with county names
Causes of Foreclosure
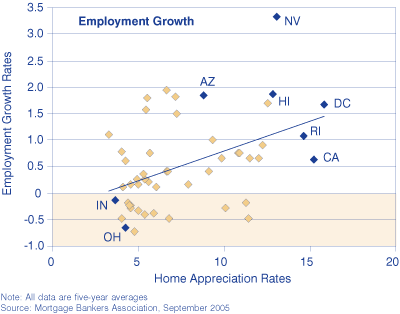
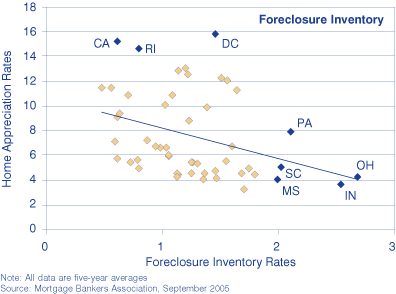
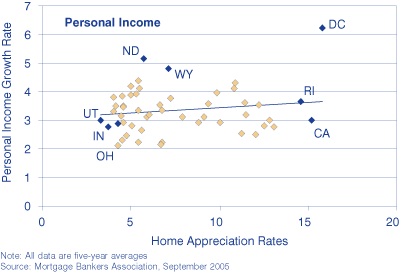
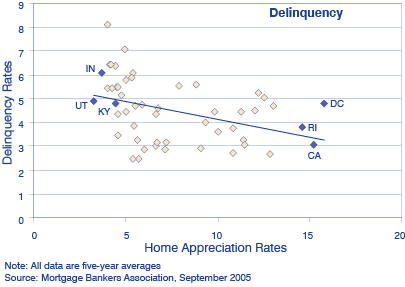
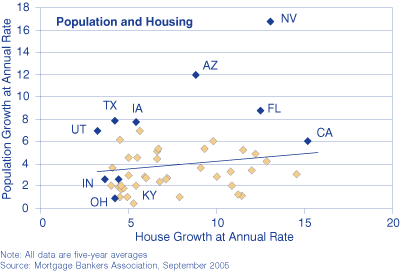
Why does our position appear to be worsening? Well, the new law is part of it, but other causes are not so new. Low home appreciation rates may not allow Hoosiers to build up equity in a home quickly, and then when trouble strikes (in the form of job loss, divorce or some other unexpected turn of events), they find themselves in foreclosure. The Mortgage Bankers Association recently looked at the housing market across the nation and made correlations between home appreciation rates and other variables. (2) Essentially, they found a positive correlation between population, personal income, employment growth and home appreciation rates. They also found a negative correlation between home appreciation rates, delinquency rates and the percent of homes in foreclosure. In other words, as population, income and employment increase, house prices tend to go up as well, and when the number of homes in foreclosure and owners delinquent on mortgage payment increases in an area, home appreciation rates tend to be lower. Figure 4 shows a series of scatter plots depicting the different scenarios.
Figure 4: Employment, Foreclosure, Income, Delinquency and Population and Housing Scatter Plots, 2005
Low home appreciation rates may not be the only cause. Five groups commissioned the National Association of Realtors to conduct a study examining Indiana’s high foreclosure rate, which was published in March 2003. Outside the factors mentioned above, the study found that the prevalence of certain loan types may be part of the problem. The study found that in 2001, the national and Indiana shares of Federal Housing Association (FHA) loans were 17 percent and 25 percent, respectively, and that FHA loans were nearly five times as likely to foreclose as conventional loans. (3) Per the commissioned study, “Coincidentally, or perhaps as a result of, the Indiana foreclosure rate began to noticeably deviate from the national rate at the same time that FHA-backed loans increased in Indiana.” Unfortunately, the study also found that Indiana has higher default rates on conventional loans as well, mainly due to higher loan-to-value ratios than most of the nation. However, this is where home appreciation rates become a factor again, because Hoosiers stay saddled longer with higher levels of debt because of laggard appreciation rates. Also, the rampant new home construction in the Indianapolis metro area is keeping appreciation rates low.
What the Future Holds
There has been discussion and alarm in the mainstream news concerning interest-only loans. According to a recent article in the Chicago Tribune, “The most popular of the new mortgage vehicles are interest-only loans, which allow borrowers to defer principal payments for five years or more. Last year, interest-only mortgages exploded to nearly 23 percent of all home loans. That was more than a tenfold increase from 2001 when interest-only mortgages represented less than 2 percent of all home loans.” (4)
The problem is that five to seven years from now, when principle payments start kicking in, the homeowner usually has three options: refinance at most likely a higher rate, pay the balance in a lump sum or start paying off the principle (in which case the payments now jump significantly since you have cut the term of the loan). (5) But according to a survey conducted by Business Week Online, only 6.9 percent of the loans issued in Indianapolis in 2004 were interest-only loans, ranking the metro area 47th out of 50 metropolitan areas across the nation. (6)
Notes
- Dave Carpenter, “Law changes spur bankruptcy filings” USA Today 23 September 2005.
- The report in its entirety can be found here: www.mortgagebankers.org/marketdata/index.cfm?STRING=
http://www.mortgagebankers.org/news/2005/MBA_Monograph_No1.pdf - The study can be found at www.indianamba.org/Downloads/Realtors%20research.pdf, and an updated version of the report can be viewed here: www.mibor.com/public/about_MIBOR_ foreclosurestudy.asp.
- Pamela Gaynor, “New loans may mortgage the future” Chicago Tribune 3 September 2005.
- Holden Lewis, “Who should and shouldn’t get an interest-only mortgage” Bankrate.com 20 October 2004.
- Peter Coy, “Top cities for risky, interest-only mortgages—Borrowers may live to regret joining the boom” BusinessWeek Online 10 June 2005.
Indiana Business Research Center, Kelley School of Business, Indiana University

