The Indianapolis Metro Area
The Area
Ten counties in central Indiana, with nearly 1.6 million residents, form the Indianapolis Metropolitan Statistical Area (metro): Boone, Brown, Hamilton, Hancock, Hendricks, Johnson, Marion, Morgan, Putnam and Shelby. The biggest cities in the region include Indianapolis, Fishers, Carmel, Lawrence and Greenwood.
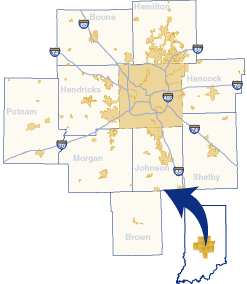
The Indianapolis metro had a 2003 population of 1,595,377, which shows a 4.6 percent growth since Census 2000. Growth in this region (70,273 people) accounted for 61 percent of the growth statewide.
Marion County is the largest county in Indiana, with 860,454 residents, and accounts for 54.1 percent of the Indianapolis metro population. As the fifth largest in the state, Hamilton County chips in another 13.6 percent of the metro population with 216,826 people.
Suburbanization is alive and well in the region, as Hamilton and Hendricks counties have dominated the region’s growth so far this decade in both numeric and percentage terms. Since 2000, Hamilton County grew 18.6 percent, adding 34,986 people. Put another way, this three-year growth was larger than the entire population in 47 Indiana counties. Since 1990, its population has nearly doubled, making it the 22nd fastest-growing county in the nation. Meanwhile, Hendricks County added 14,757 residents with a growth of 14.2 percent between 2000 and 2003. Marion County, however, gained less than 3,000 people.
Projections from the Indiana Business Research Center indicate that Boone, Hamilton, Hendricks and Johnson counties will be among the five fastest-growing counties in the state, growing more than 40 percent between Census 2000 and 2040. According to these projections, Hamilton will surpass St. Joseph (South Bend) and Allen (Fort Wayne) counties to become the third largest county in the state by 2040. Looking at a smaller time-span, the metro area is expected to grow 20 percent from current levels in the next fifteen years, reaching over 1.9 million by 2020.
Industrial Mix and Jobs
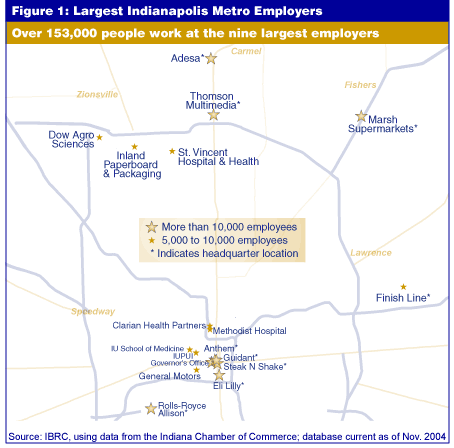
The Indianapolis metro area is home to many of the state’s largest and most well-known companies (see Figure 1).
Indianapolis’ metro job mix differs than the state most significantly in manufacturing. As shown in Figure 2, the metro had just 12.2 percent of its jobs in manufacturing in the second quarter of 2004—7.8 percentage points less than the state average. It still made up the largest share of employment, however, followed closely by health care and social services (11.6 percent) and retail trade (11 percent).
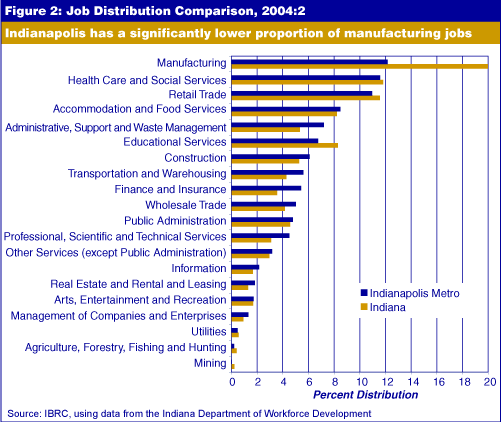
Sectors playing larger roles in the metro area than in the state’s industrial mix overall are wholesale trade; administrative, support and waste management; professional, scientific and technical services; and transportation and warehousing.
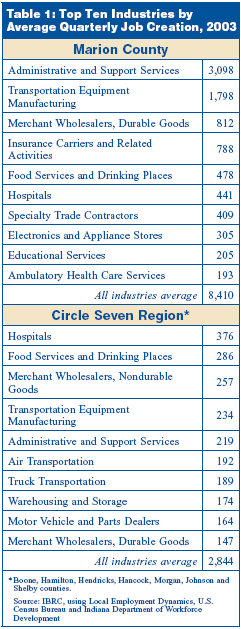
As people move toward the edges of the metro, is job growth from new and expanding businesses occurring more there than in Marion County itself? According to local employment dynamics data, the answer is no. The average quarterly job creation for the Circle 7 region (that is, the counties touching Marion: Boone, Hamilton, Hendricks, Hancock, Morgan, Johnson and Shelby counties) was 2,844 in 2003. For Marion County alone, it was 8,410 jobs. As seen in Table 1, administrative and support services had the largest average job creation in Marion County, while hospitals were the industry leader in the Circle 7 region.
According to the Indianapolis Business Journal, the fastest-growing public companies in terms of revenue between 2001 and 2003 in the region include Fortune Diversified Industries, Windrose Medical Properties Trust, Anthem, Galyan’s Trading Co., Brightpoint, Finish Line and Guidant.(1) Each company had revenue growth of 40 percent or higher.
Commuting
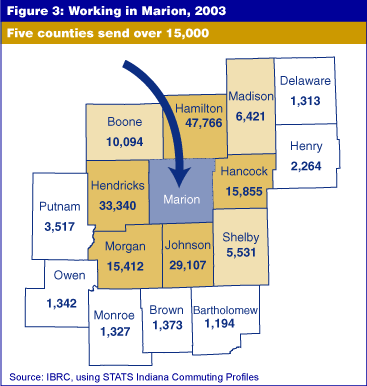
Over 1 million people work in the Indianapolis metro area, according to preliminary commuting data for 2003. Roughly 67 percent of those people work in Marion County, which draws over 190,000 people from other counties, both inside and outside the metro. In fact, 21 Indiana counties send more than 500 commuters into Marion County and 15 counties send more than 1,000 (see Figure 3).
Compensation
Using the new compensation data available from the U.S. Bureau of Economic Analysis, we find that those working in the region received over $40.6 billion in compensation for 2003 (see Table 2). Nearly 81 percent was in the form of wages, with an additional 13.5 percent in the form of employer contributions for employee pension and insurance funds. The remaining 5.8 percent was employer contributions for government social insurance. Not surprisingly, pensions and insurance premiums constitute an increasing percentage of total compensation in the metro, state and nation.
Figure 4 shows the differences in total average compensation per job by county. Marion County led the pack in 2003 at $48,220, while Brown County trailed at $25,325. Marion County ranks sixth statewide on this measure, while Hamilton County ranks seventh. (Howard County, with its high concentration of manufacturing employment and recent increases in employer pension contributions, ranks first, and Martin County, with the Crane Naval Base, ranks second. Gibson, Posey and Fayette counties round out the top five.)
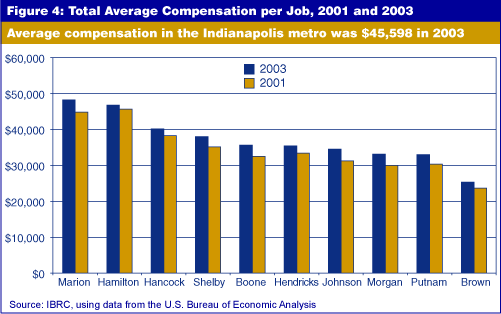
Marion County saw the biggest dollar increase ($3,377) in the region between 2001 and 2003, while Johnson and Morgan counties saw the largest percent change (10.4 percent). With a 2.6 percent gain totaling $1,168, Hamilton County compensation did not even keep up with inflation and it had the smallest increase in the metro, both in percentage and numeric terms. That said, average compensation per job in Hamilton County remains among the highest in the state.
Notes
- “2005 Book of Lists.” Indianapolis Business Journal 25 (41): 72.
Rachel Justis
Managing Editor, Indiana Business Research Center,
Kelley School of Business, Indiana University

