Job Losses Since Peak: Revised and Revisited
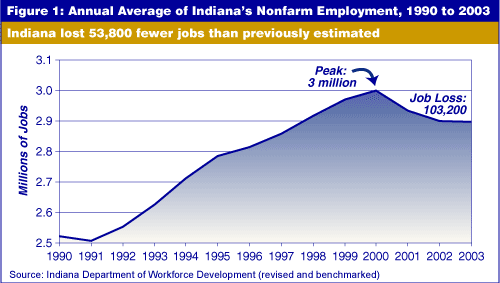
The advent of spring symbolizes many things—basketball championships, potholes, tax filing and buds on the trees. To those of us who analyze data, spring is benchmarking time … a time to rethink how we characterize job loss during and beyond the recent recession. Using the latest benchmarked and revised data from the Indiana Department of Workforce Development, Indiana’s job losses between its peak employment year of 2000 (3 million jobs) and 2003 has been pegged at 103,200.
During the past two years, Indiana’s job losses, when gauged month-to-month using seasonally or not seasonally adjusted data, were 150,000 or more. Within the pages of this publication, it was pegged at 157,000 jobs lost between July 2000 to late summer 2003 (see In the Details from the September/October 2003 issue). As of March 2004 and based on the latest benchmarked revisions by the Indiana Department of Workforce Development, Indiana lost 103,200 jobs since our peak in 2000 (see Figure 1). This is more than 50,000 less than what was reported using monthly estimates.

Why Do These Data Change All the Time?
For good, sound reasons. The comings and goings of employees are estimated by use of a monthly survey conducted by the Indiana Department of Workforce Development. This monthly survey of approximately 7,500 payroll establishments in Indiana gives us a month-to-month estimate of payroll jobs in Indiana and its metropolitan areas. When the current month (there is a six- to eight-week lag) is released, it is marked preliminary. When the next month’s data are released, the previous month’s data are marked revised because the statistical process accommodates new information from late arrivals of the survey, corrections, etc. The focus of the survey and the processing techniques is on accuracy, which serves us best in the long run.
But this process of continual revisions means that the already published jobs number for a given month can change at least once. But wait, there’s more. Note that “at least once.” In the interests of accuracy, the current employment statistics are benchmarked against the quarterly payroll census, also collected by the same department. The people who conduct and process the survey, the revisions and the benchmarking are working toward accuracy. Good data collection and statistical processing take time—time we aren’t always willing to give these people.
Good Things Come to Those Who Are Patient
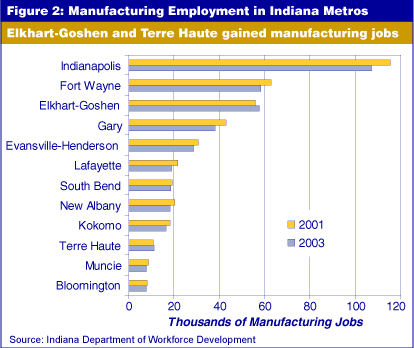
Now that March 2004 is here, the newly benchmarked estimates for 2003 and previous years’ annual averages are ready for those of us who want to know how many jobs Indiana really lost over the past three years. More importantly, we have more solid estimates from which we can learn which sectors and subsectors were winners or losers over the past two, five or 10 years (see Figure 2). After all, the idea is to use these data to help inform decisions on the economic well-being and the future of our state and communities. Don’t we want the best data we can get?

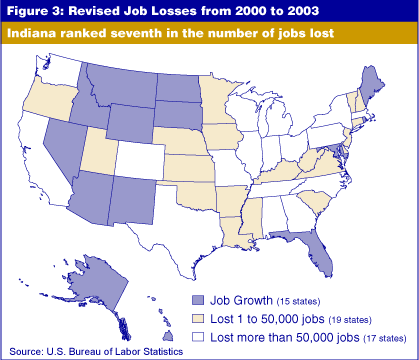
The majority of states lost jobs between 2000 and 2003 (see Figure 3). But 15 states actually gained jobs and Vermont essentially showed no change in jobs over that time.

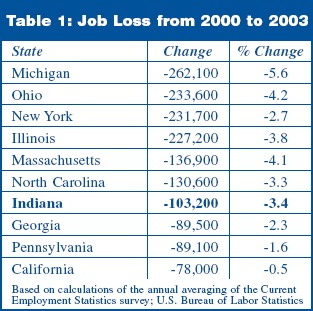
Remember, a year or two ago Indiana was touted as having been the number one job-losing state in America. As shown in Table 1, Indiana is not even in the top five when looking at the benchmarked data, although it is part of the Big 10 in more ways than one.

Carol O. Rogers
Associate Director, Indiana Business Research Center,
Kelley School of Business, Indiana University
